横軸が対数軸の棒グラフを作成する方法
SAS を使った場合
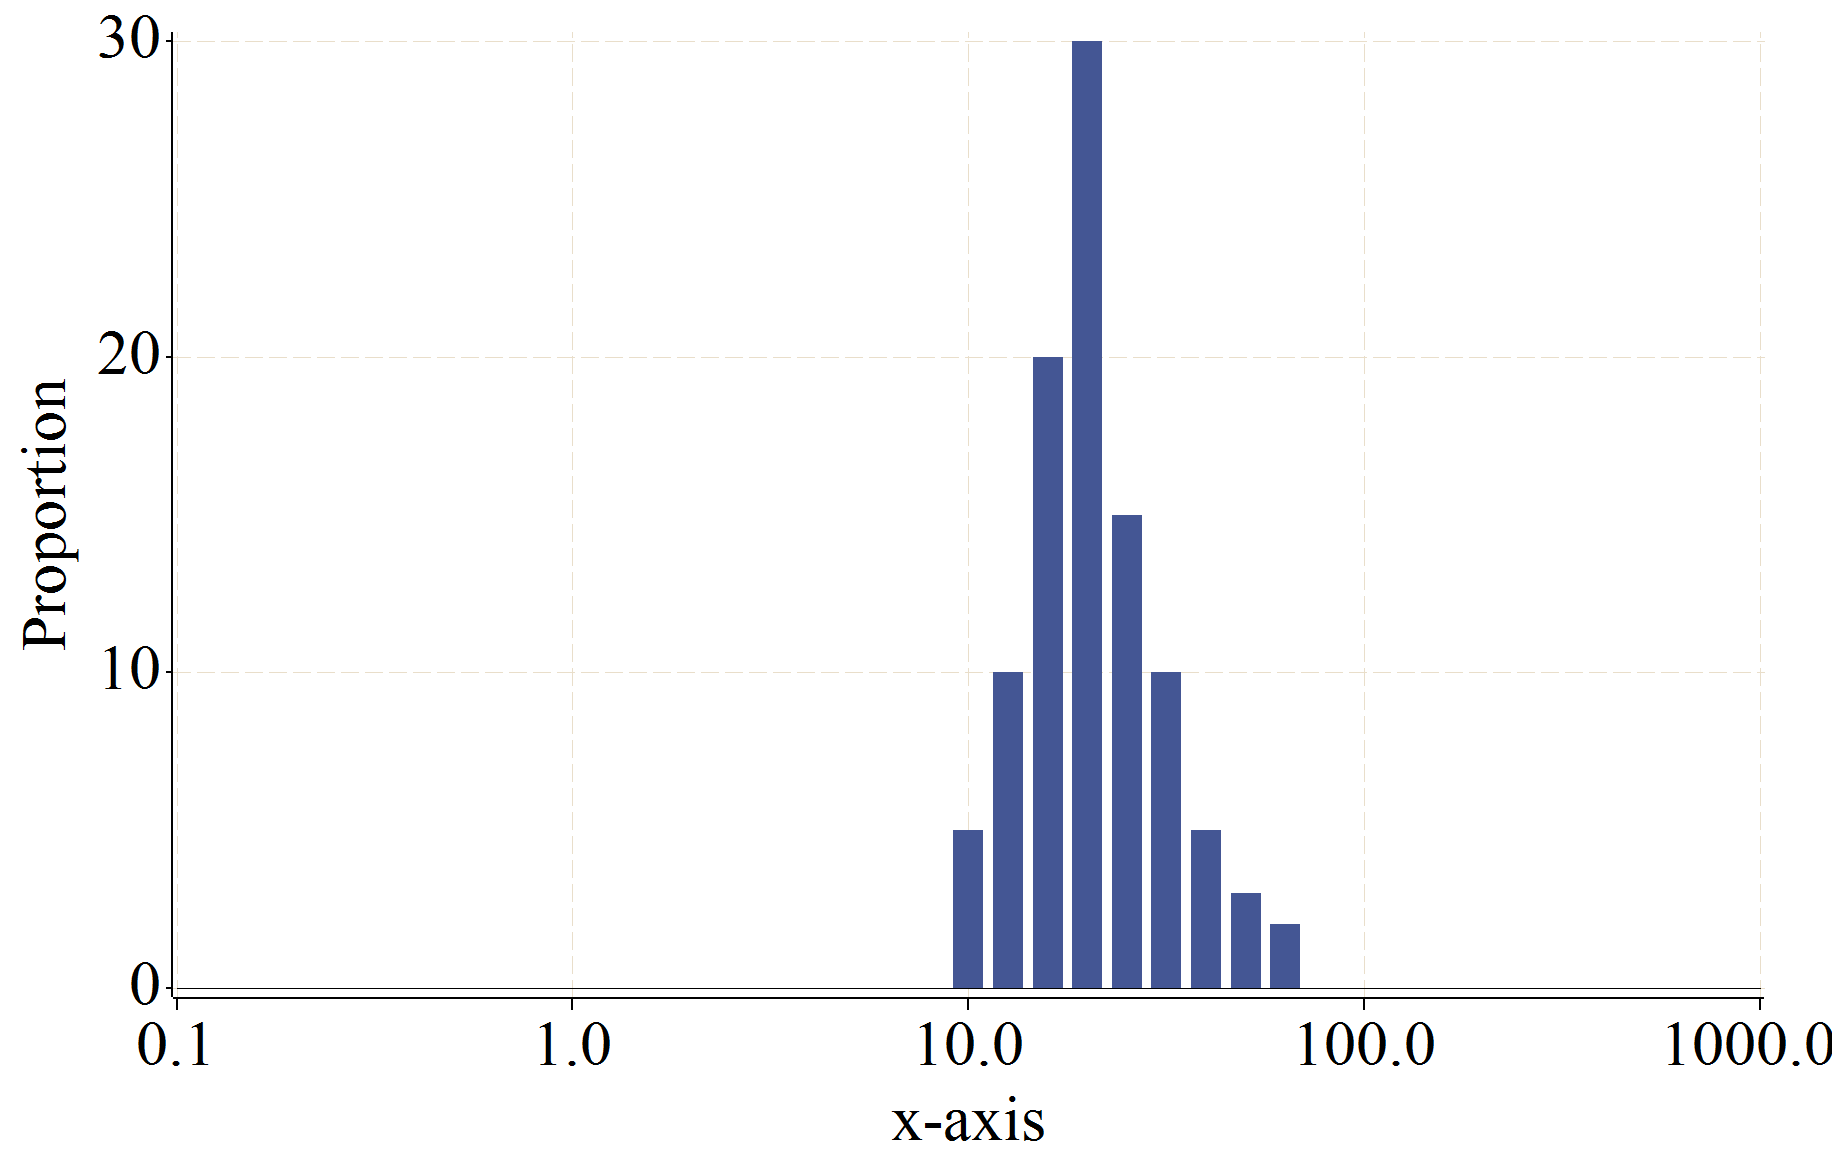
SAS で横軸が対数軸の棒グラフを作成する場合は、gplot procedure の axis statment で logbase = 10 を使用し、symbol statment で i = needle を指定します。
  data x;
  input x y @@;
  cards;
      0.10   0    0.13   0    0.16   0    0.20   0
      0.25   0    0.32   0    0.40   0    0.50   0
      0.63   0    0.79   0    1.00   0    1.26   0
      1.58   0    2.00   0    2.51   0    3.16   0
      3.98   0    5.01   0    6.31   0    7.94   0
      10.00  5   12.59  10   15.85  20   19.95  30
      25.12 15   31.62  10   39.81   5   50.12   3
      63.10  2   79.43   0  100.00   0  125.89   0
    158.49   0  199.53   0  251.19   0  316.23   0
    398.11   0  501.19   0  630.96   0  794.33   0
    1000.00   0
  ;
  proc print; run;

  goptions reset = all;
  goptions vsize = 12 in hsize = 19 in htitle = 2 htext = 2;
  goptions ftext = "Times New Roman";

  proc gplot data = x;
    plot y * x /
      autovref lautovref = 2 cautovref = cxE9DECA
      autohref lautohref = 2 cautohref = cxE9DECA
      haxis = axis1 vaxis = axis2 noframe nolegend;
    axis1 label = ('x-axis')
          major = (w=2 height=0.7) w=2 minor = none logbase = 10;
    axis2 label = (a=90 'Proportion')
          major = (w=2 height=0.7) w=2 minor = none;
    symbol1 i = needle c="cx445694" w = 10 l = 1;
  run; quit;
R の ggplot2 package を使った場合
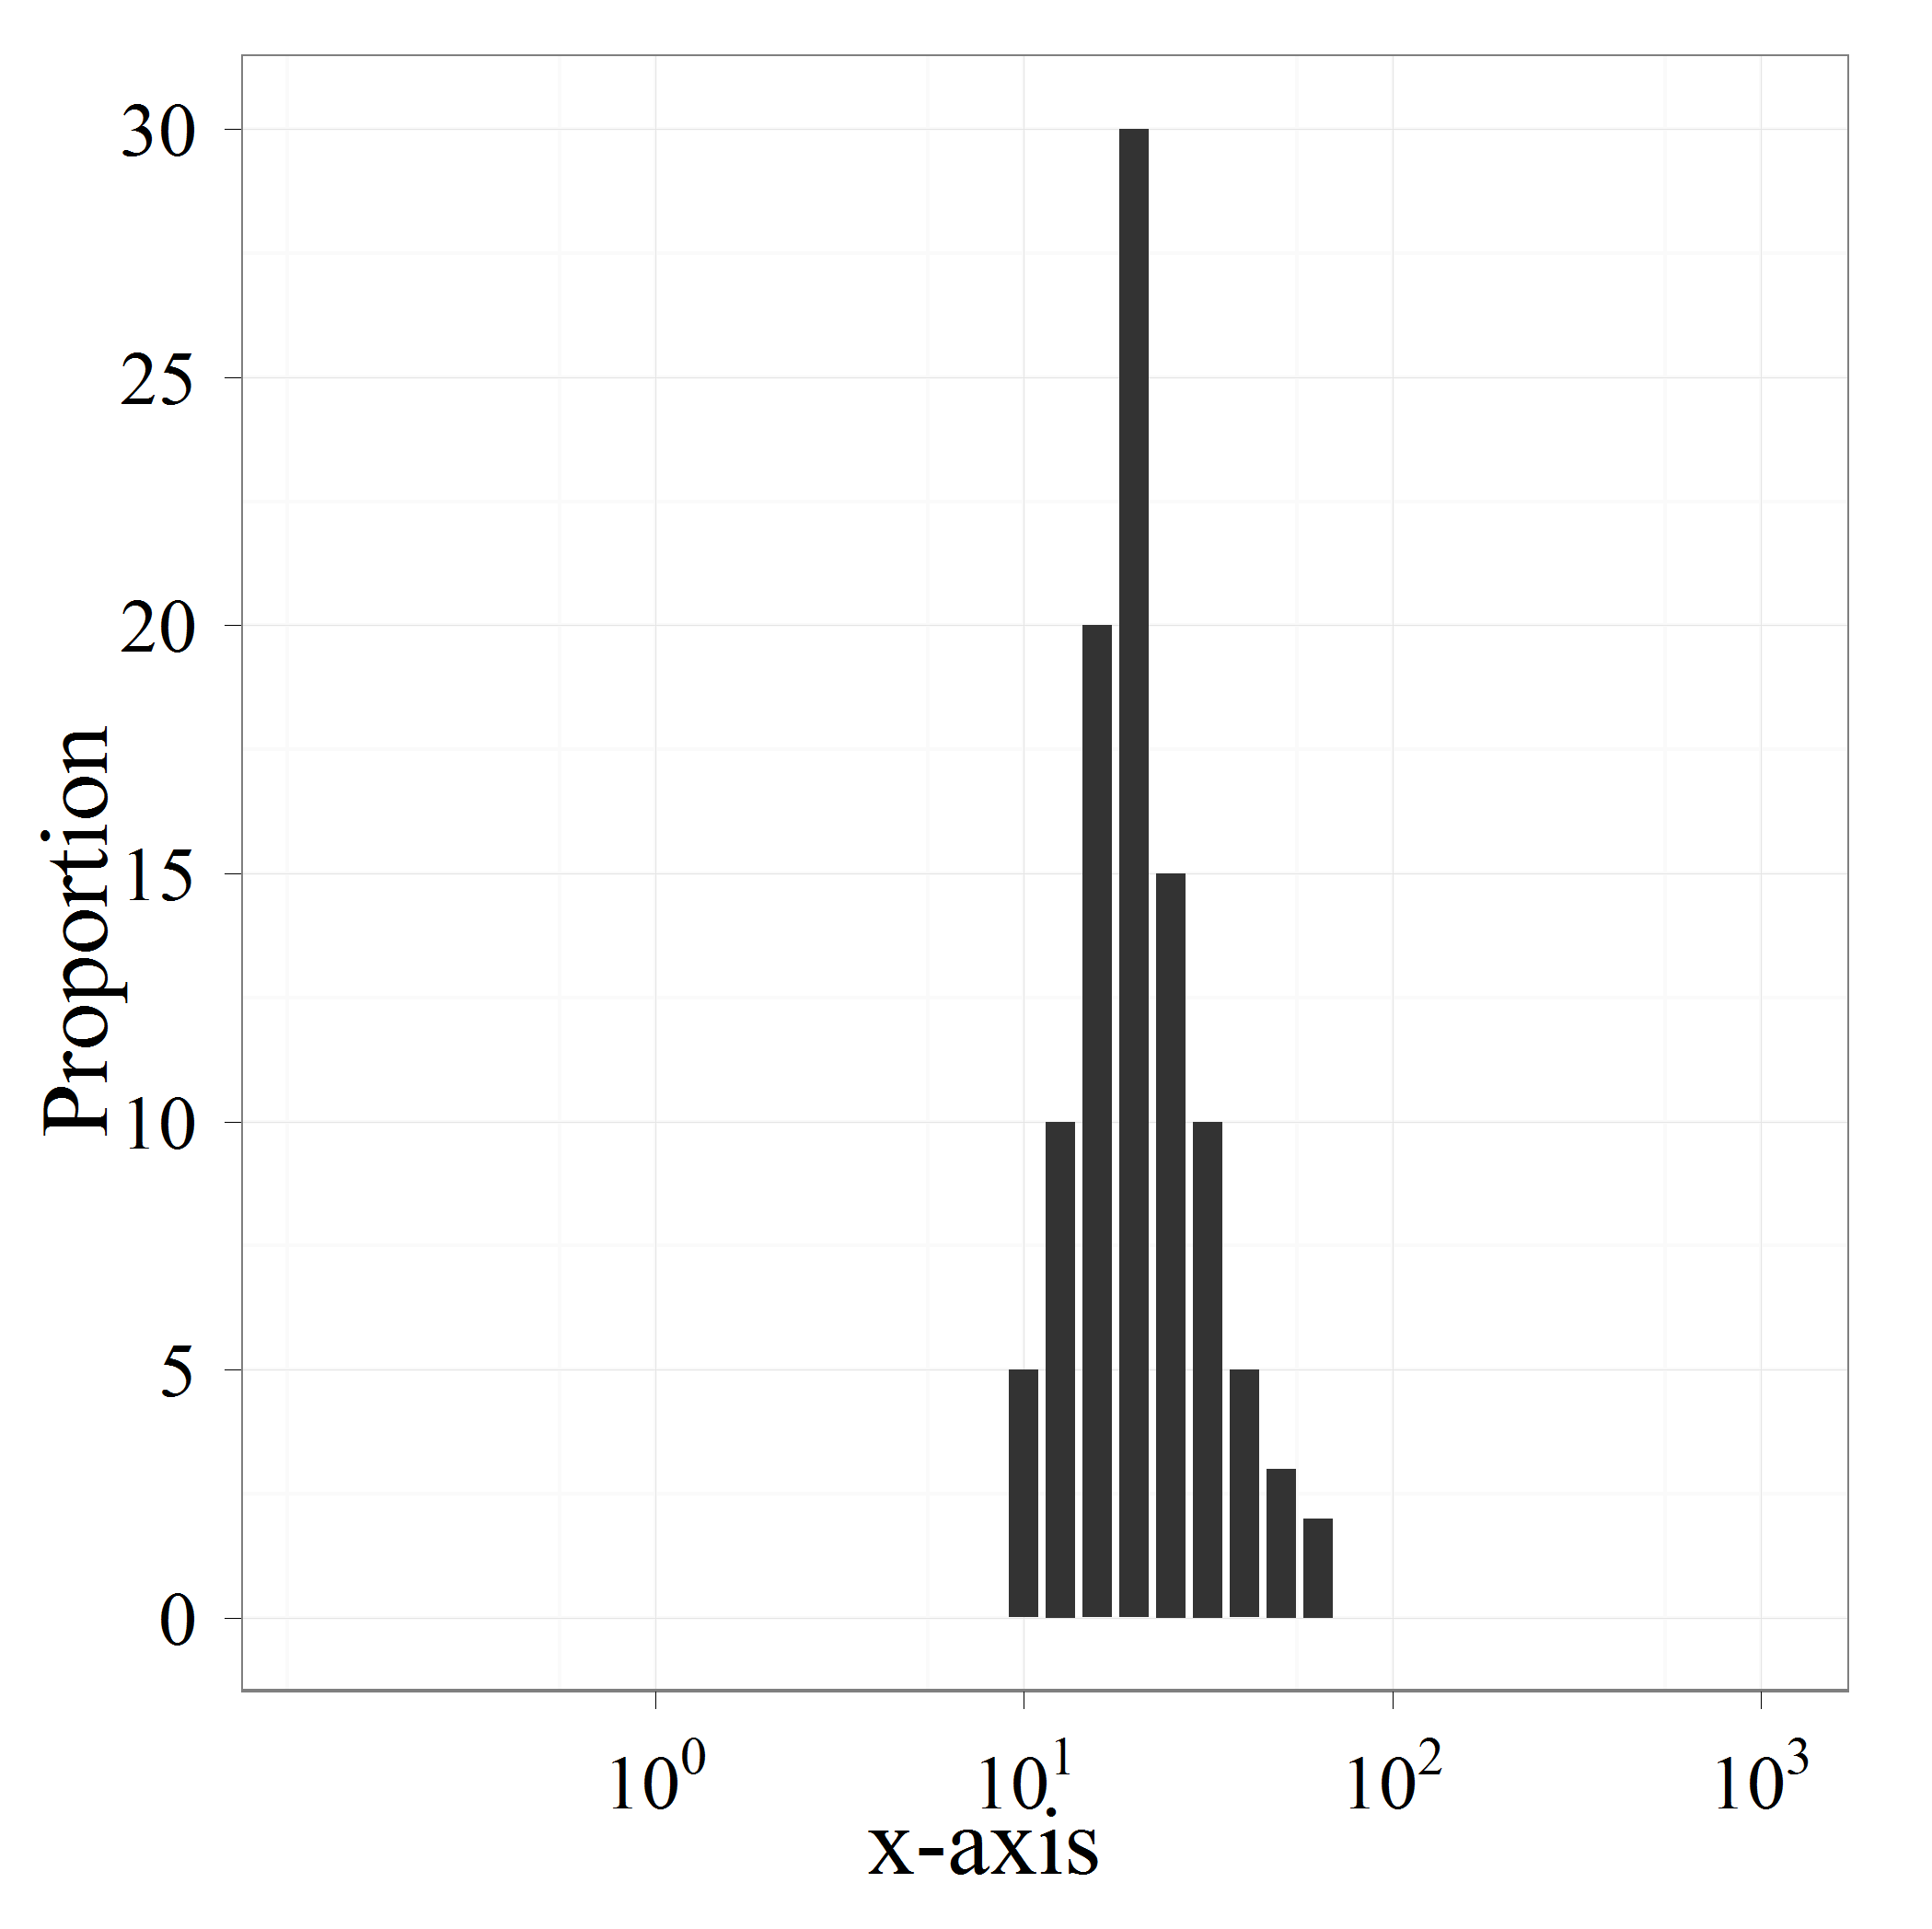
ggplot2 package で横軸が対数軸の棒グラフを作成する場合は、geom_bar(stat = "identity") と scale_x_log10() を指定します。
  require(ggplot2)

  df <- structure(list(x = c(0.13, 0.16, 0.2, 0.25, 0.32, 0.4, 0.5, 0.63,
  0.79, 1, 1.26, 1.58, 2, 2.51, 3.16, 3.98, 5.01, 6.31, 7.94, 10,
  12.59, 15.85, 19.95, 25.12, 31.62, 39.81, 50.12, 63.1, 79.43,
  100, 125.89, 158.49, 199.53, 251.19, 316.23, 398.11, 501.19,
  630.96, 794.33, 1000), y = c(0L, 0L, 0L, 0L, 0L, 0L, 0L, 0L,
  0L, 0L, 0L, 0L, 0L, 0L, 0L, 0L, 0L, 0L, 0L, 5L, 10L, 20L, 30L,
  15L, 10L, 5L, 3L, 2L, 0L, 0L, 0L, 0L, 0L, 0L, 0L, 0L, 0L, 0L,
  0L, 0L)), .Names = c("x", "y"), class = "data.frame", row.names = c(NA,
  -40L))

  p <- ggplot(df, aes(x=x, y=y)) + geom_bar(stat = "identity") +
    scale_x_log10() + xlab("x-axis") + ylab("Proportion") +
    theme_bw(25, "serif")
  print(p)
  ggsave("myplot.png", p)
補足
Excel では横軸が数値軸の棒グラフを簡単に作ることができないようです。
履歴
- 2011/07/21 公開

