%kmdata 2.2.2
The %kmdata macro
This macro generates extended Kaplan-Meier plots with the SAS/STAT GPLOT procedure.
The features:
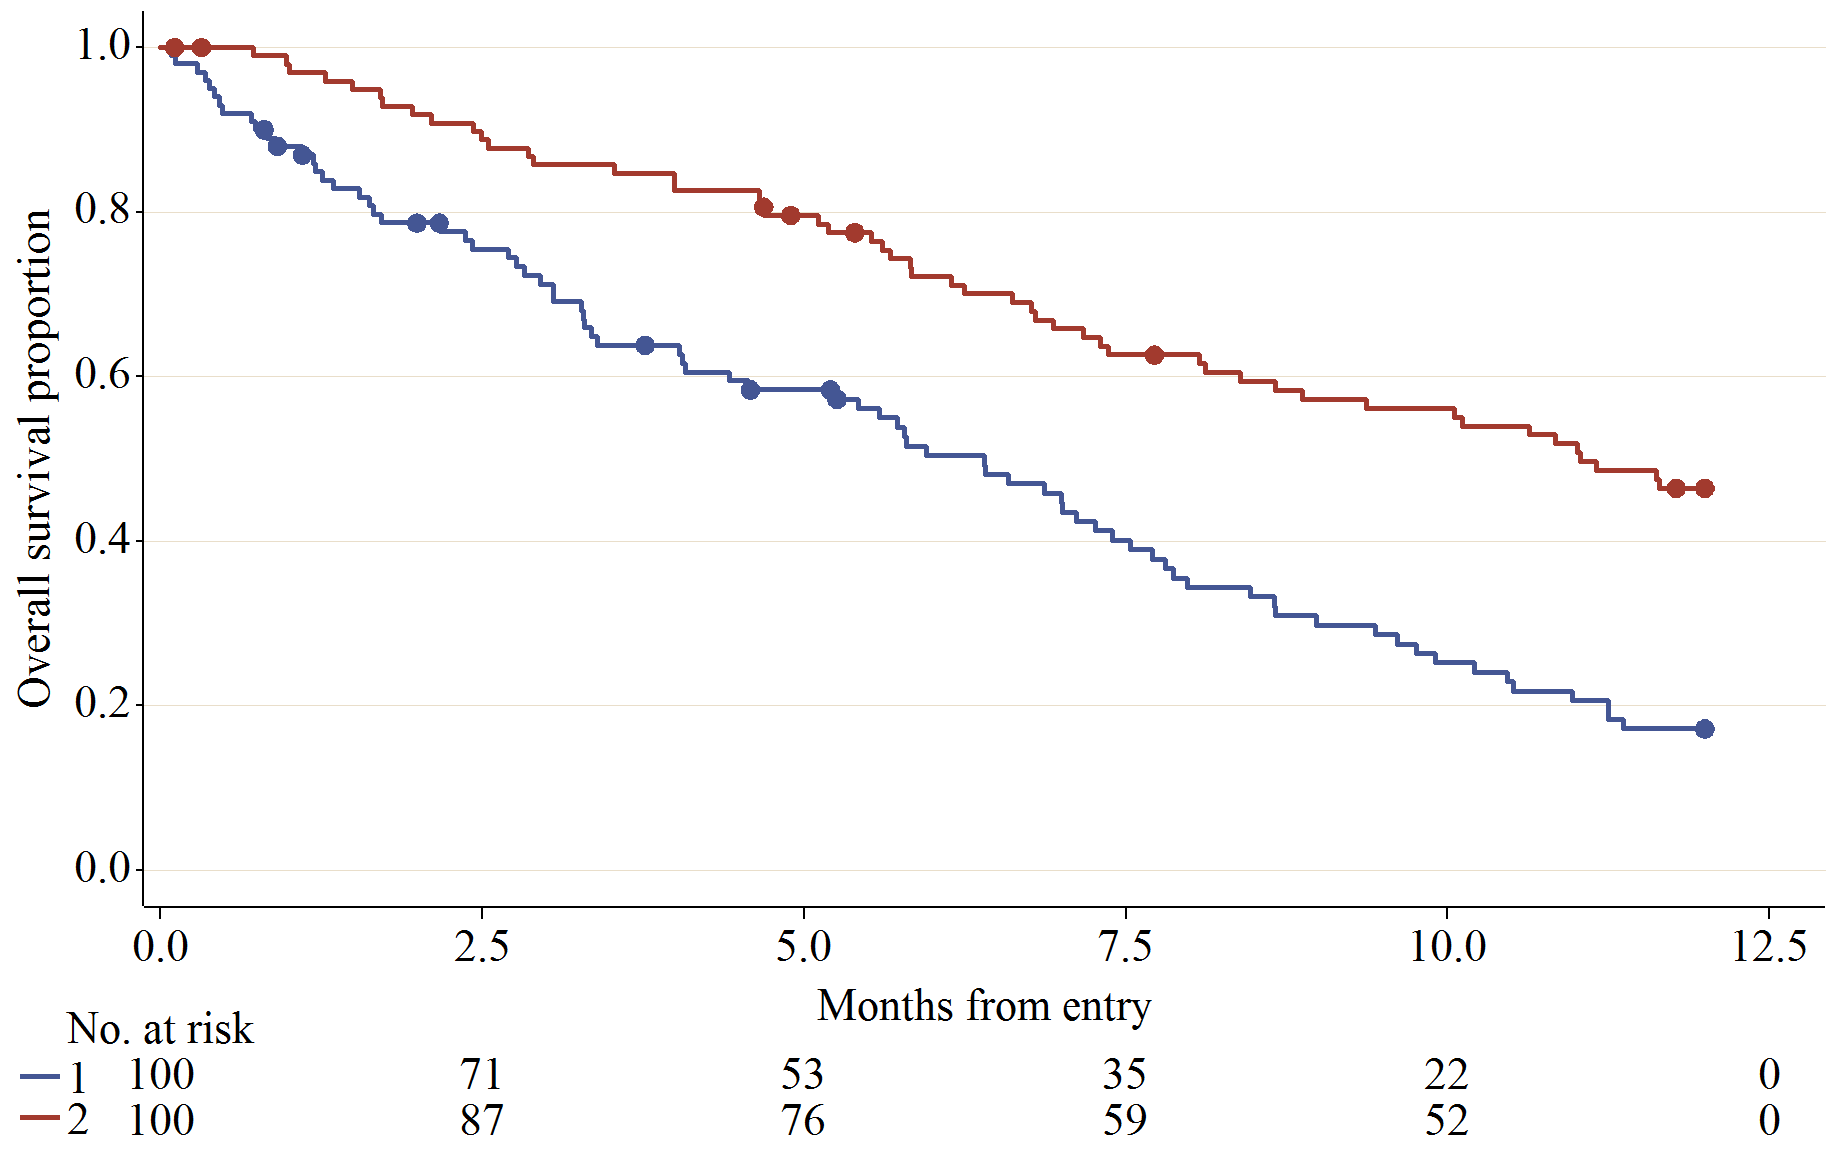
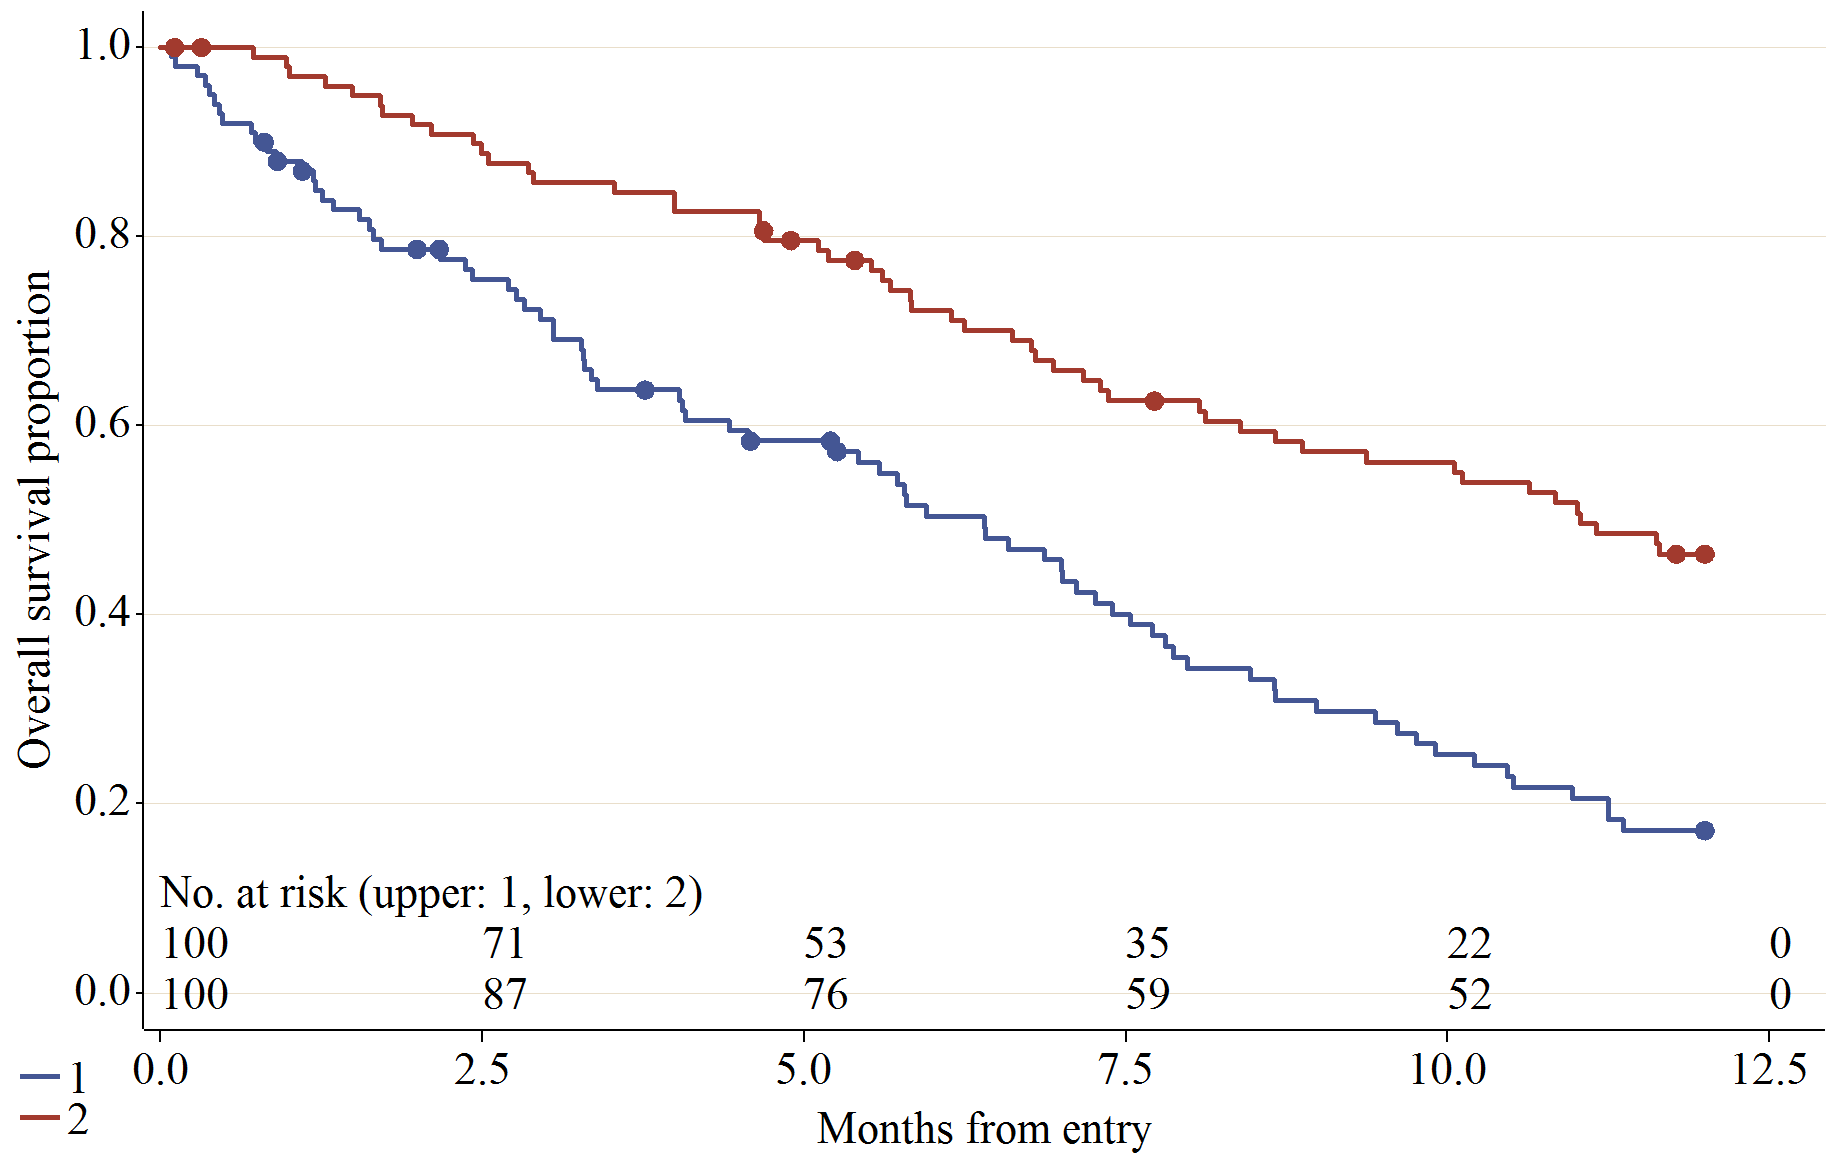
- Can add no. at risk table on inside and outside.
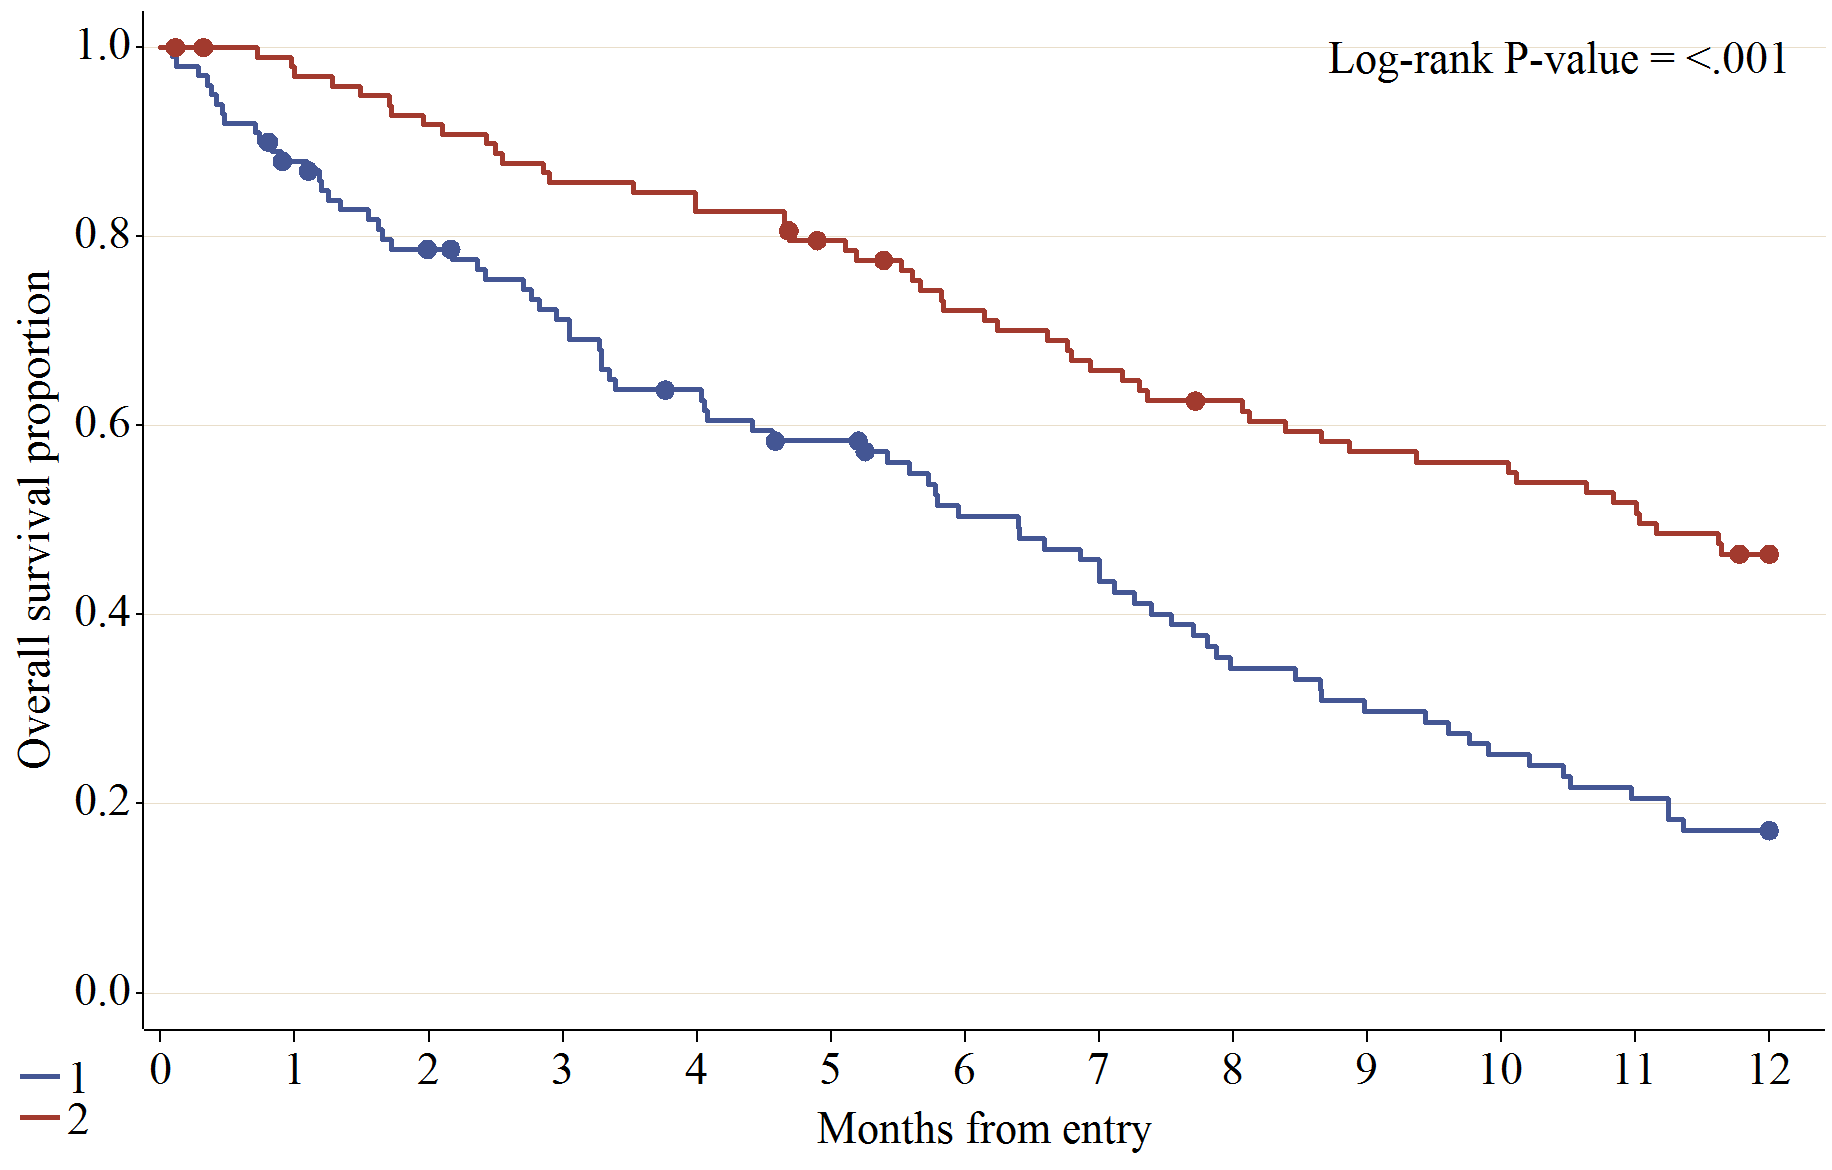
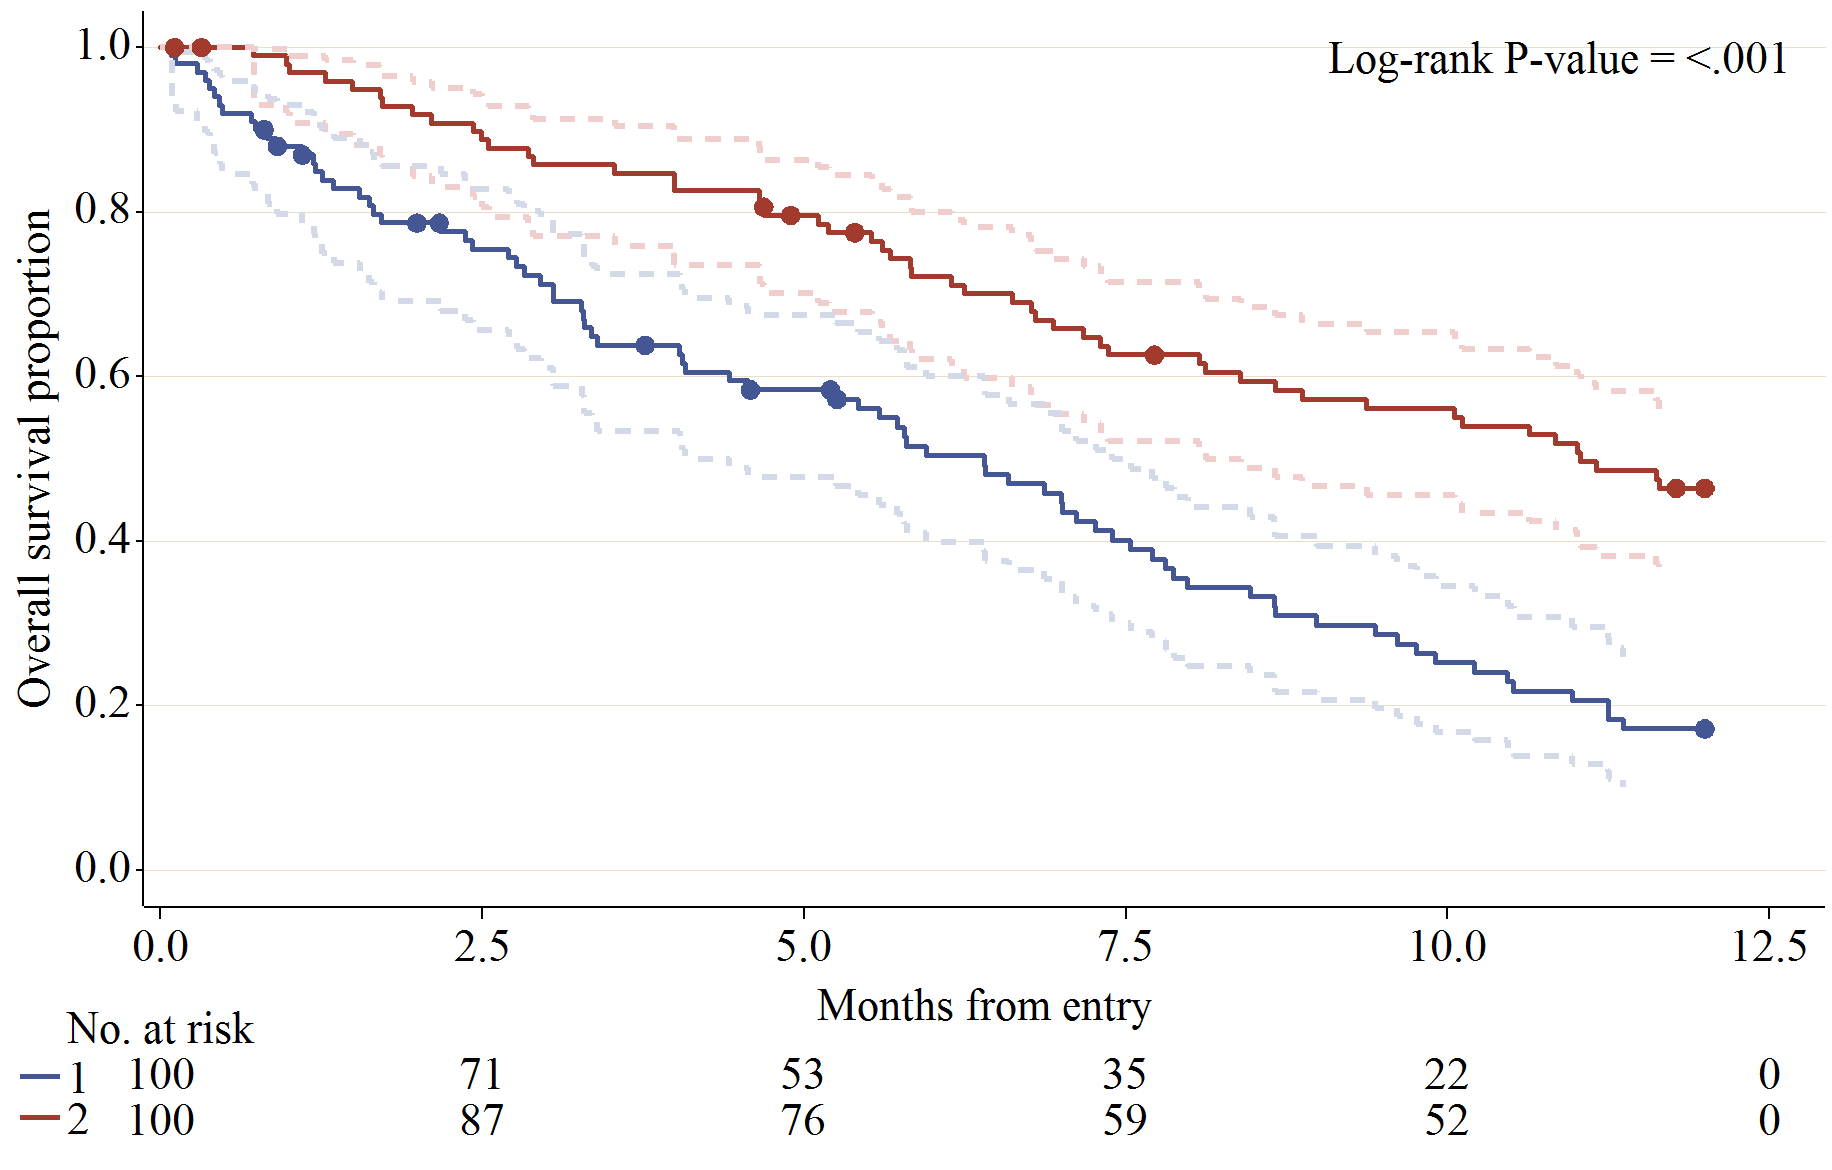
- Can add a result of the homogeneity test (log-rank, generalized wilcoxon, or likelihood ratio test).
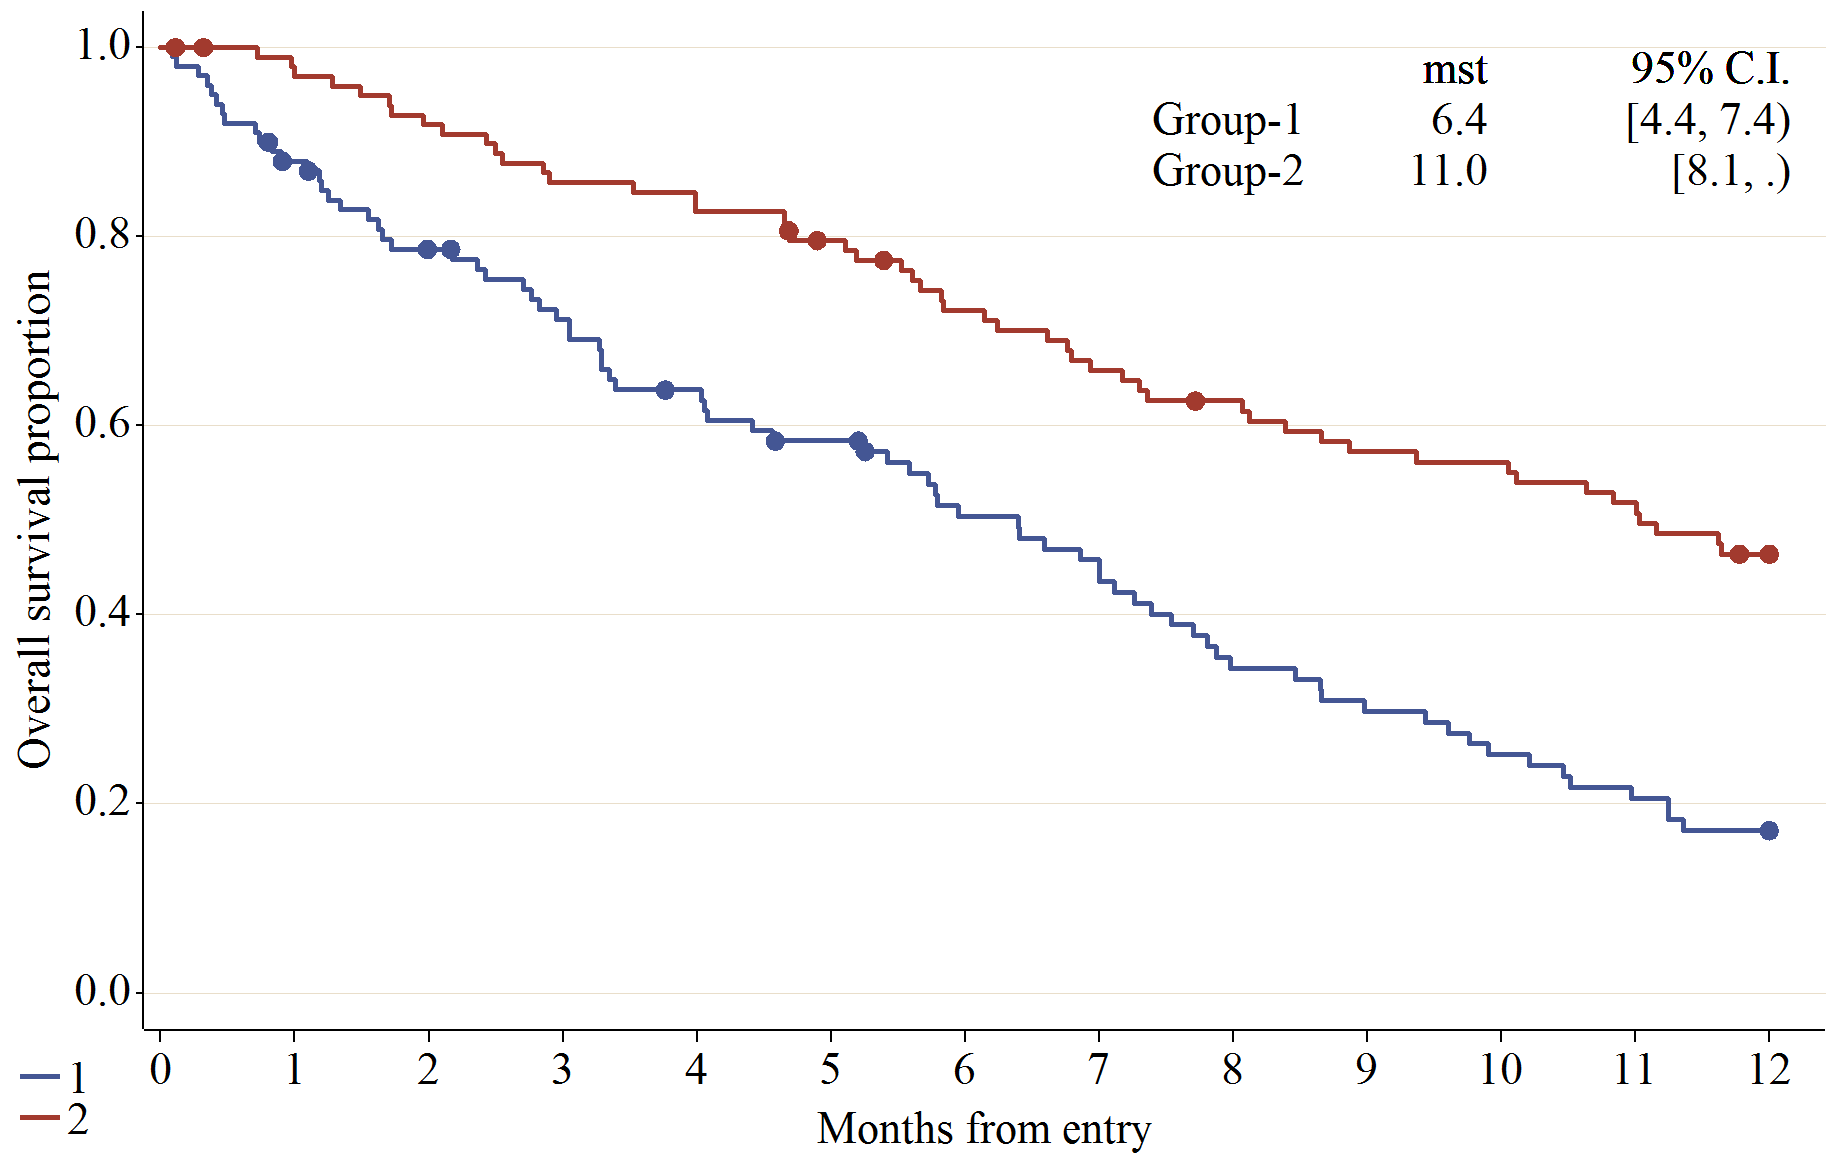
- Can add median survival estimates.
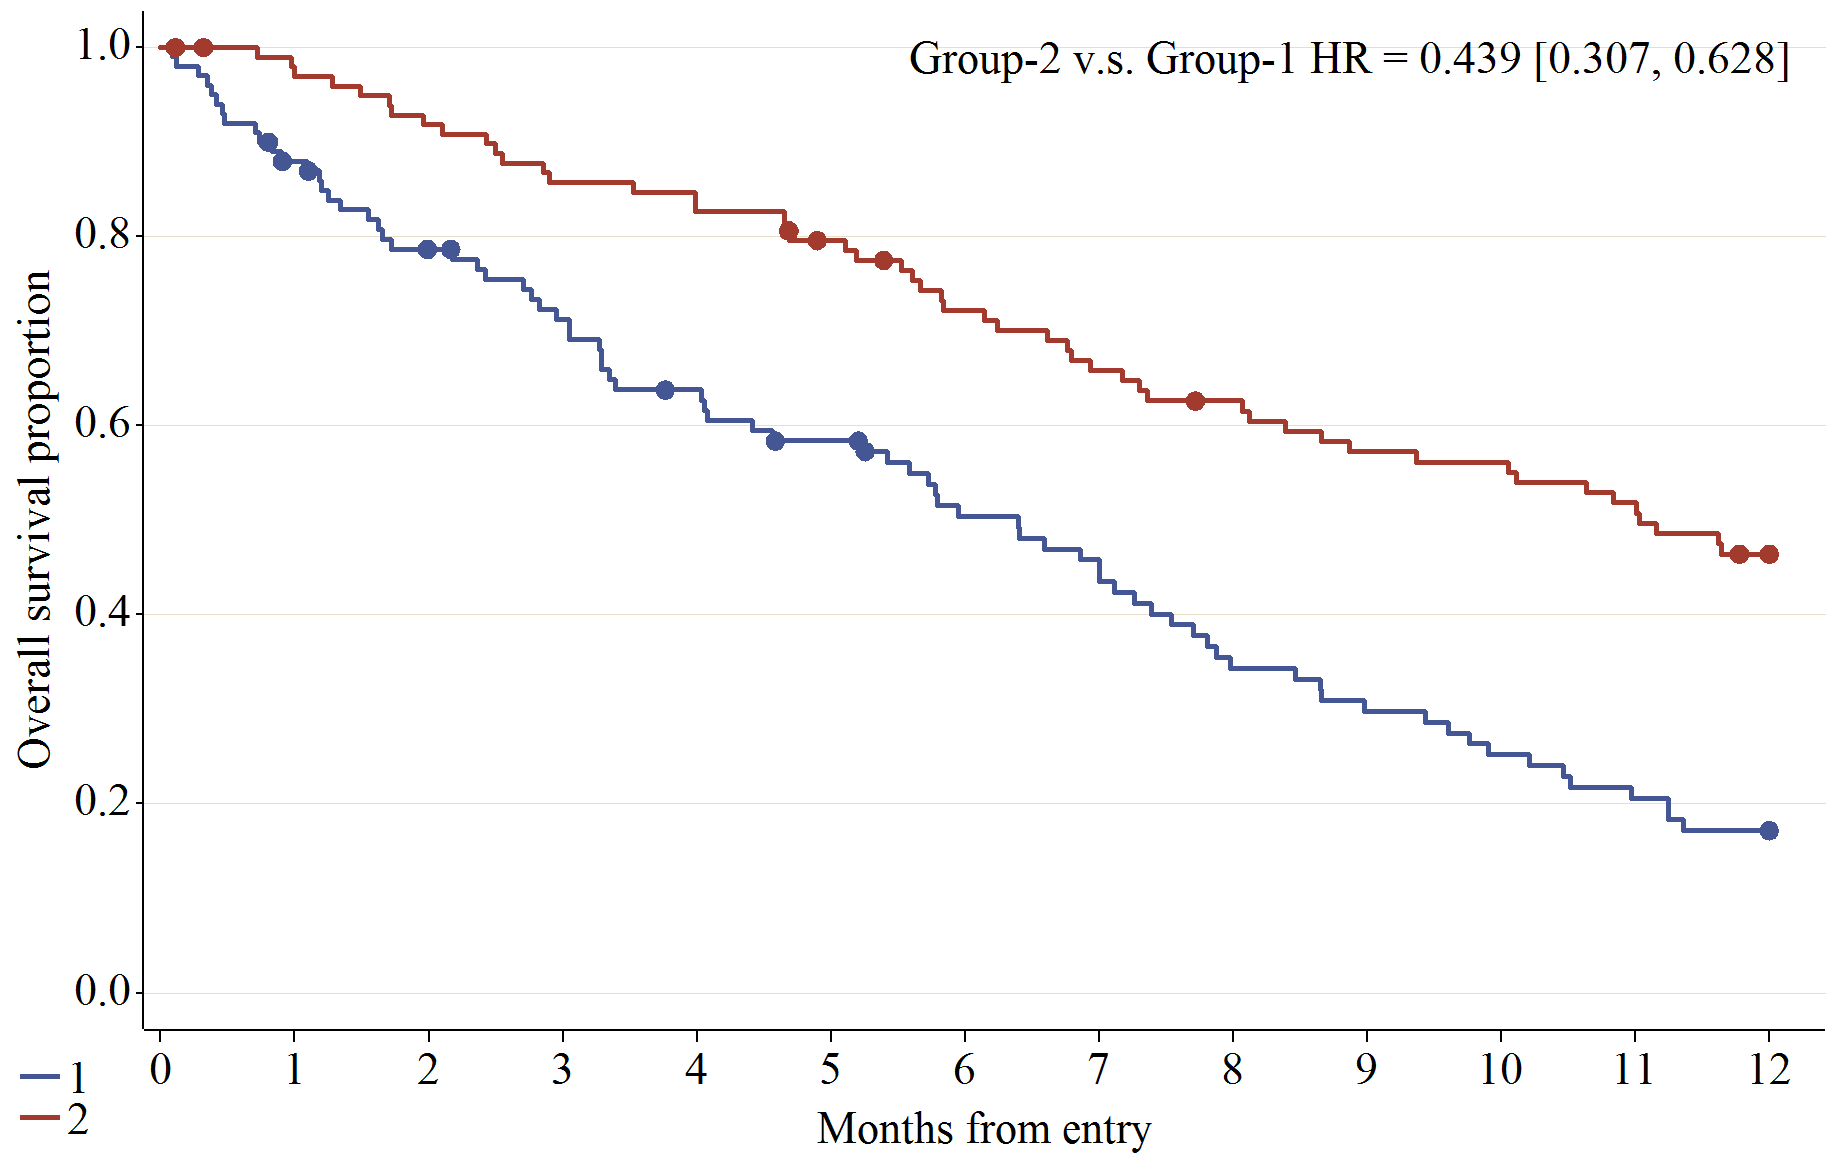
- Can add hazard ratios estimated by the Cox's proportional hazards model.
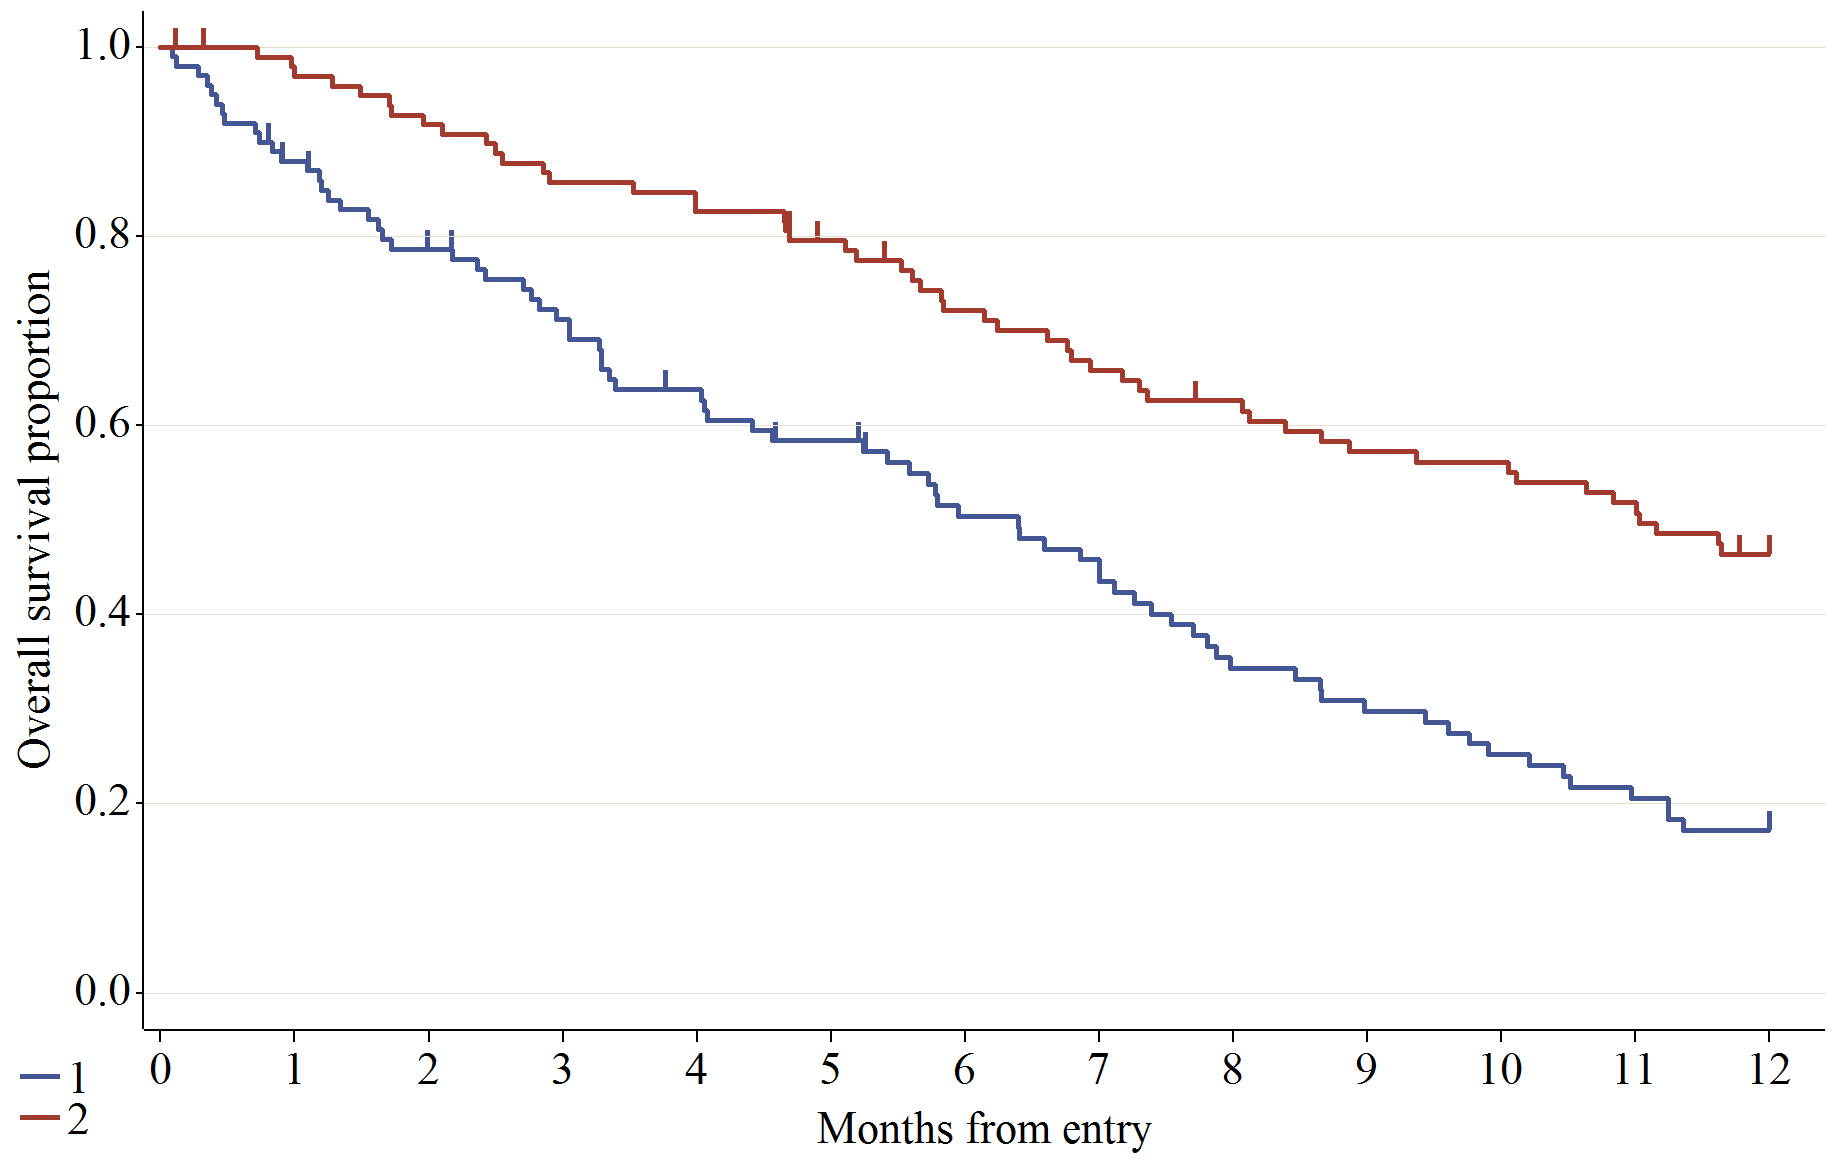
- Can use neelde symbols for censored observation.
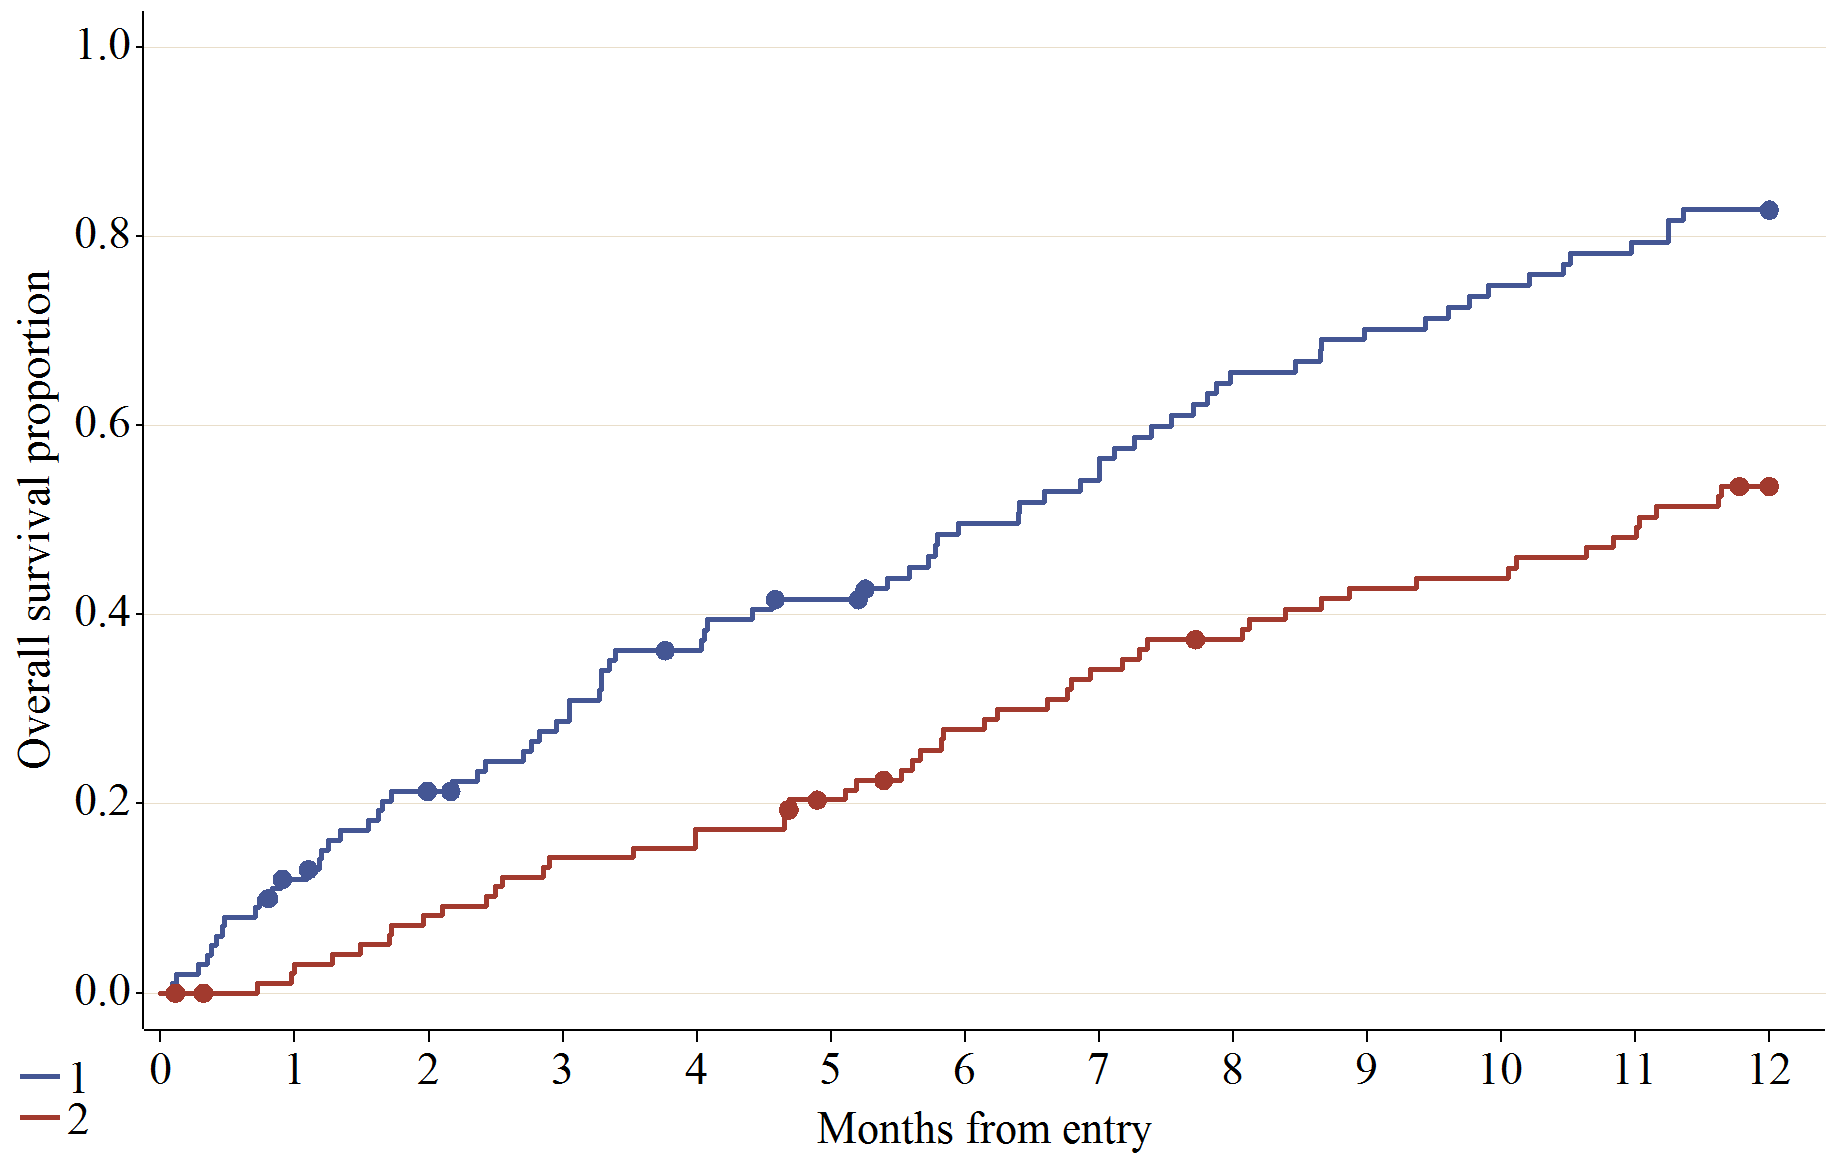
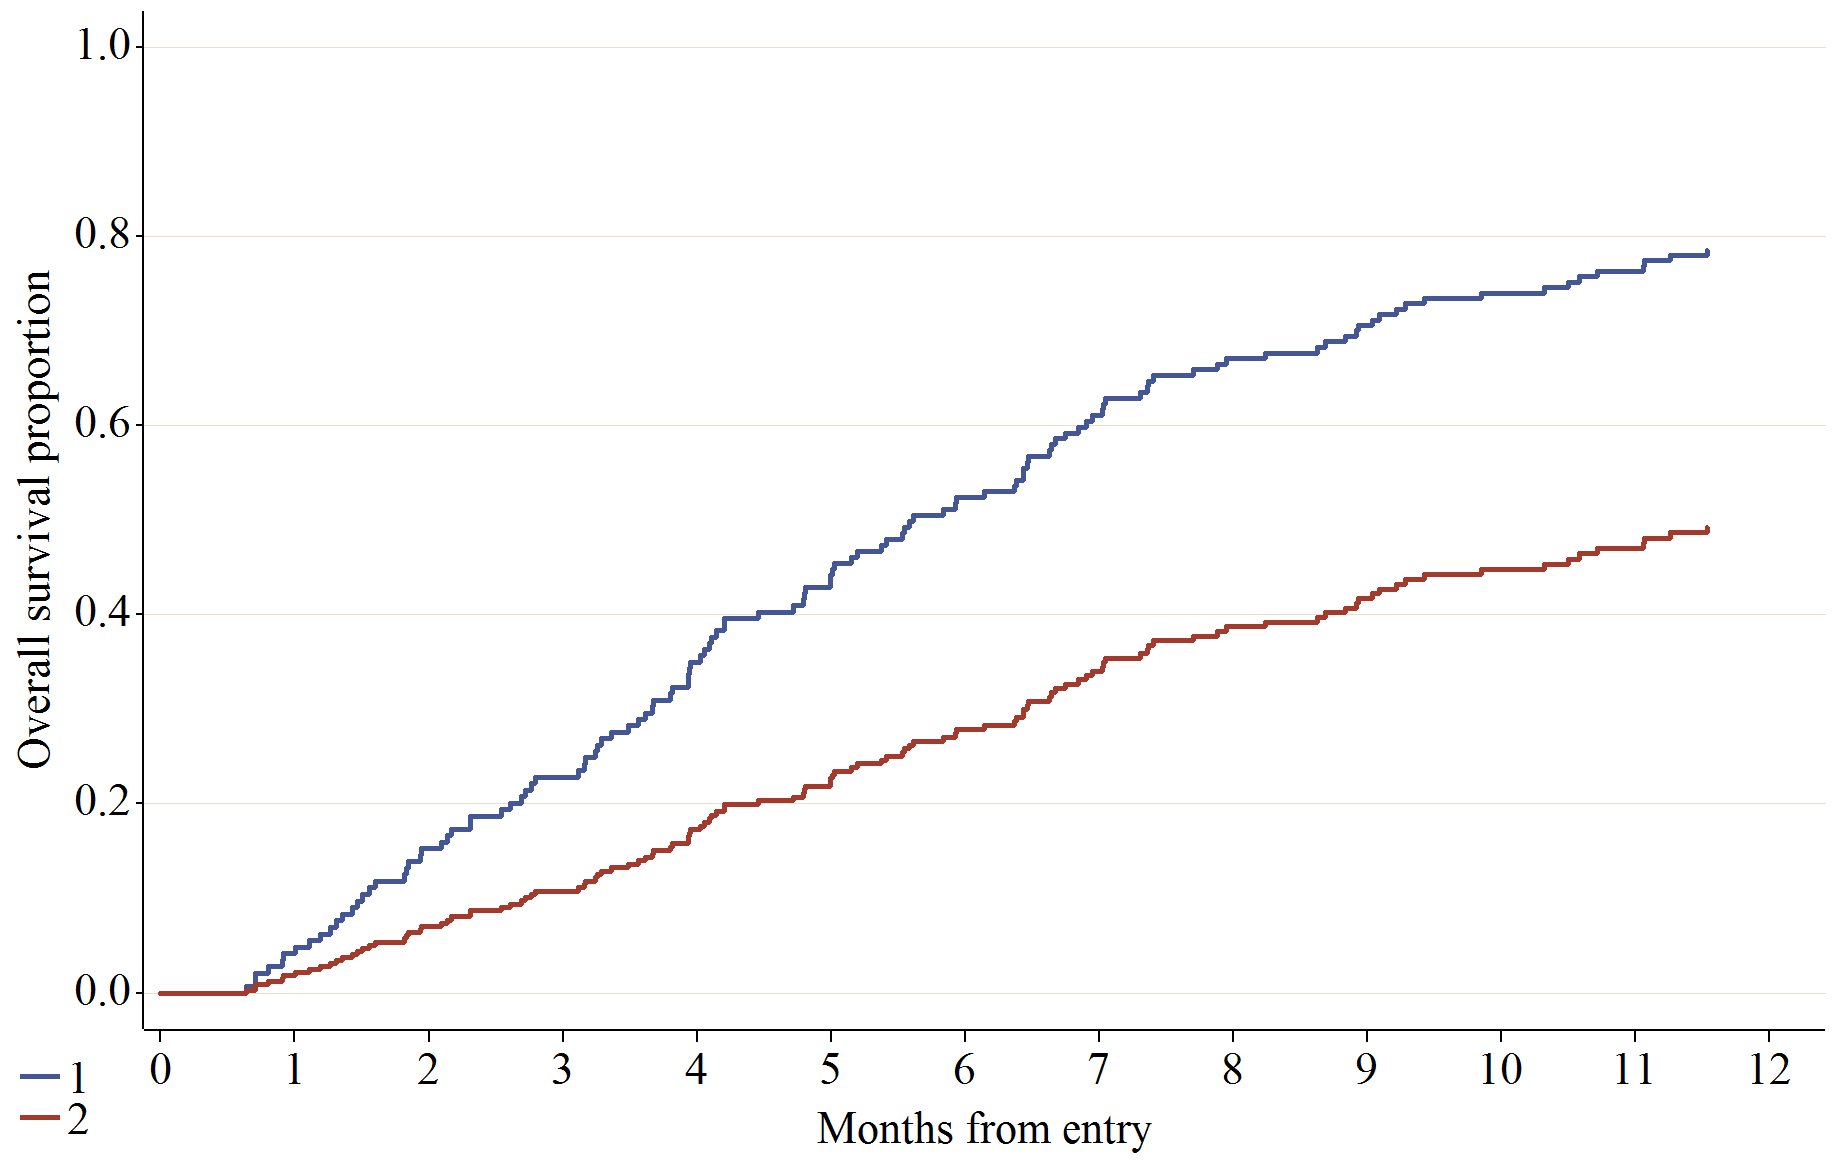
- Can draw failure plots.
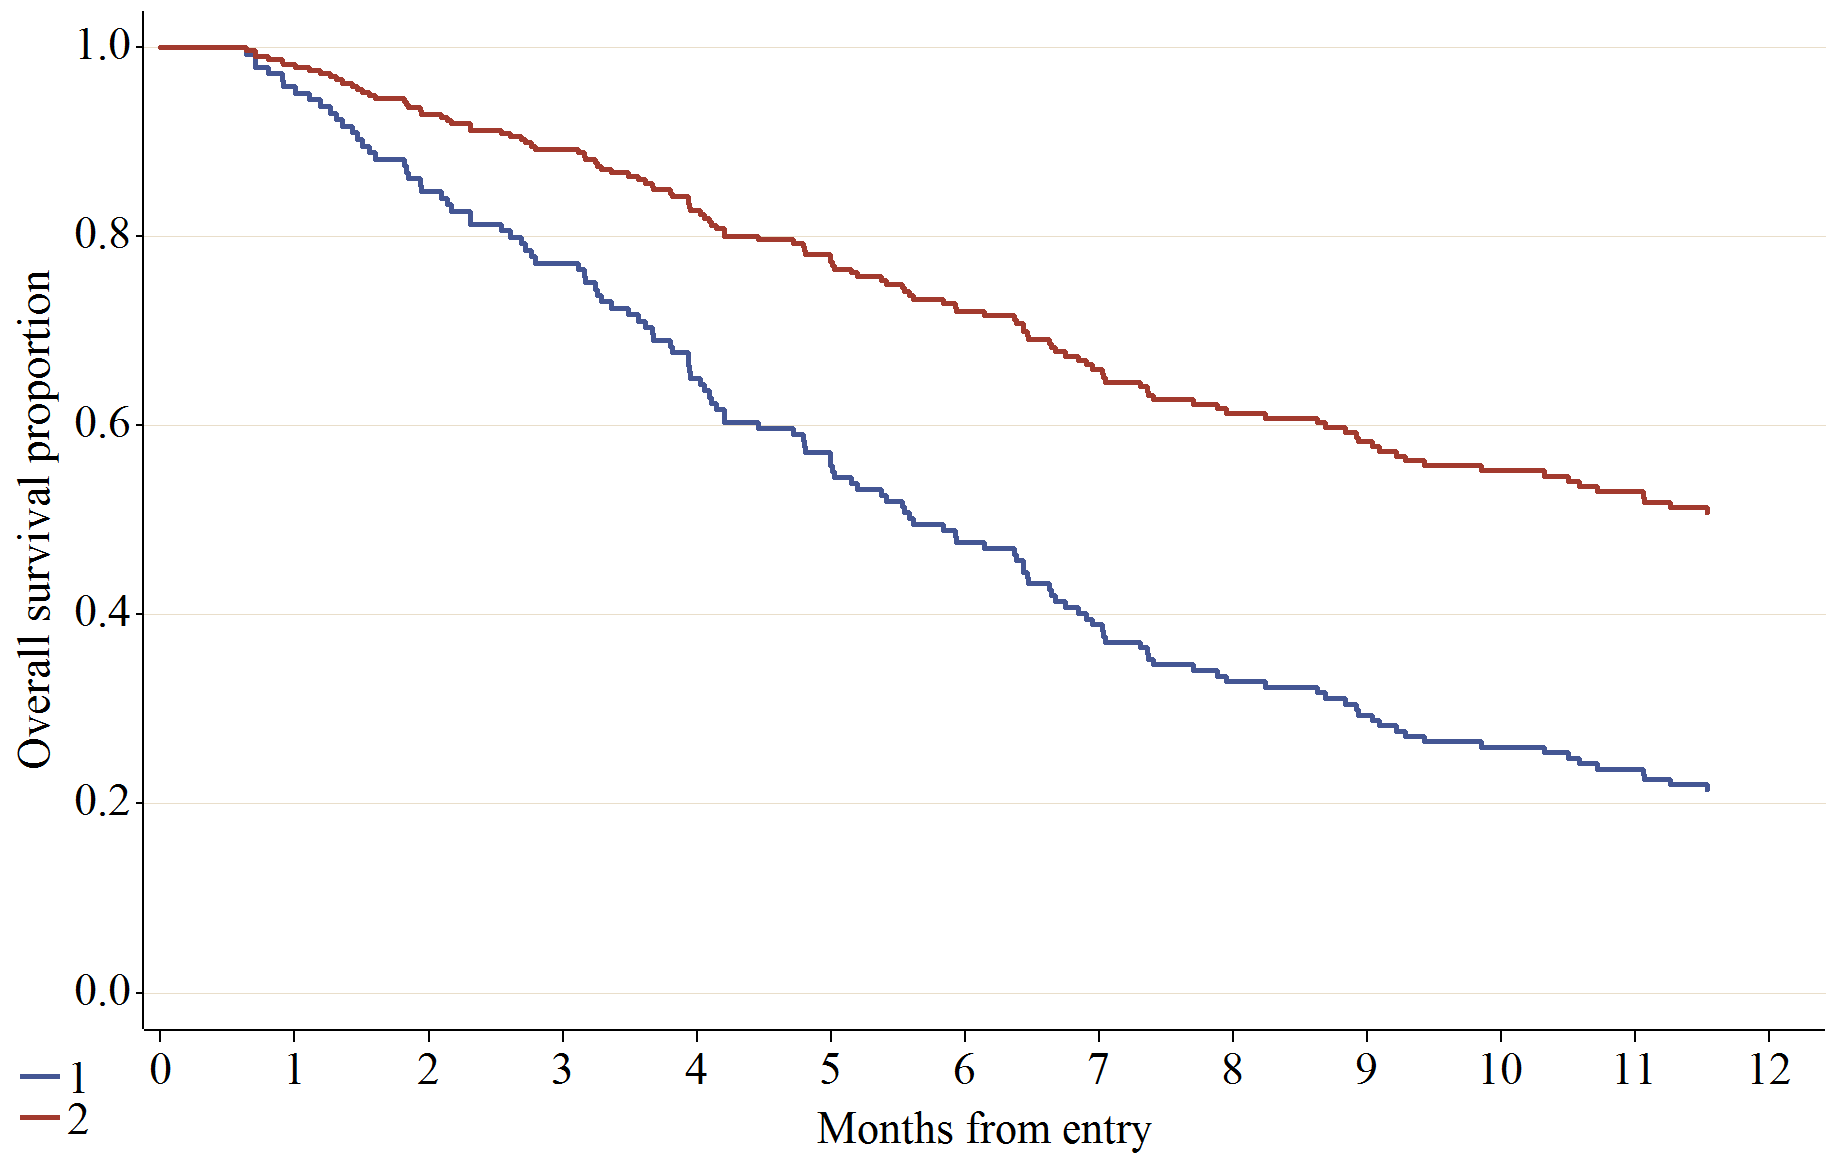
- Can draw adjusted plots by using baseline statement.
kmdata_v222.zip (download)
If any questions, please email me.
sample SAS scripts generator
If any questions, please email me.
Examples
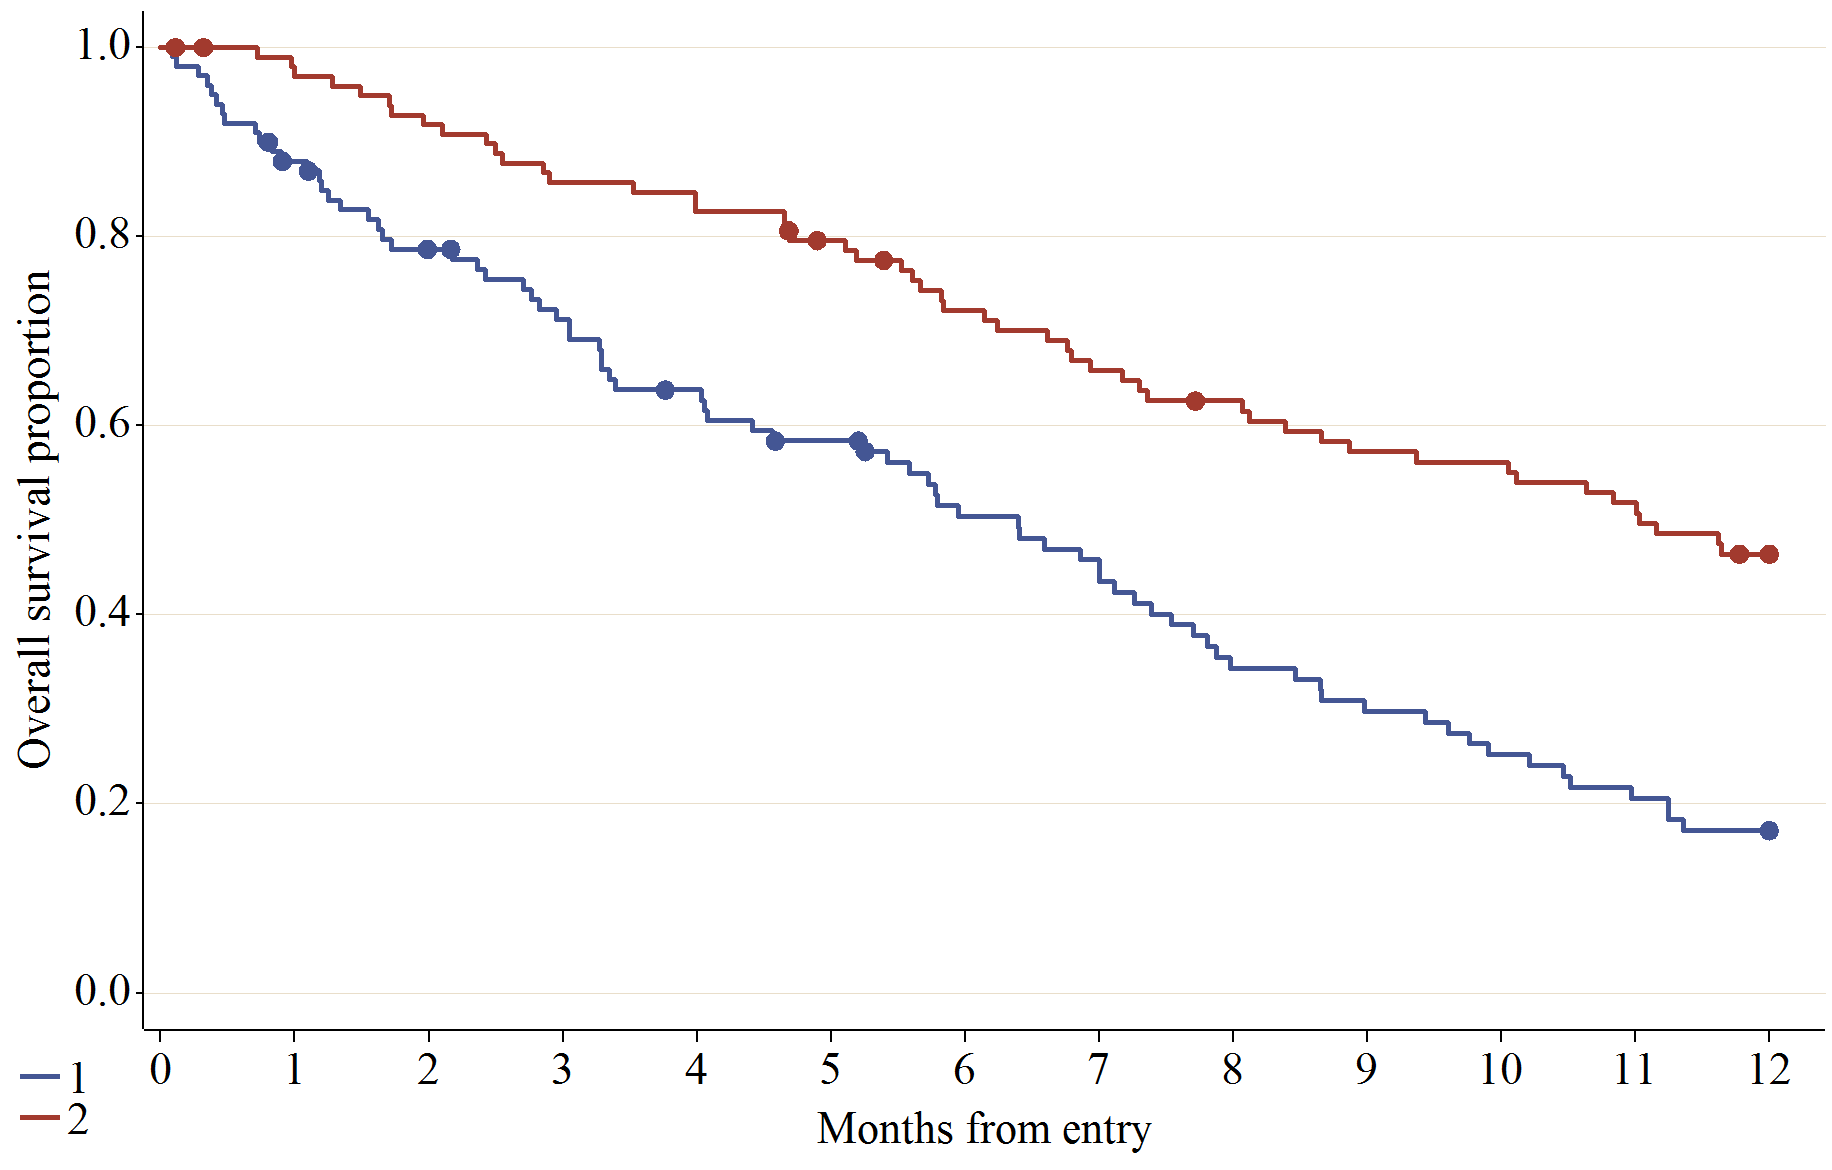
Default:
Special censor symbols:
Homogeneity test:
Hazard ratios:
Median survival:
Failuer plot:
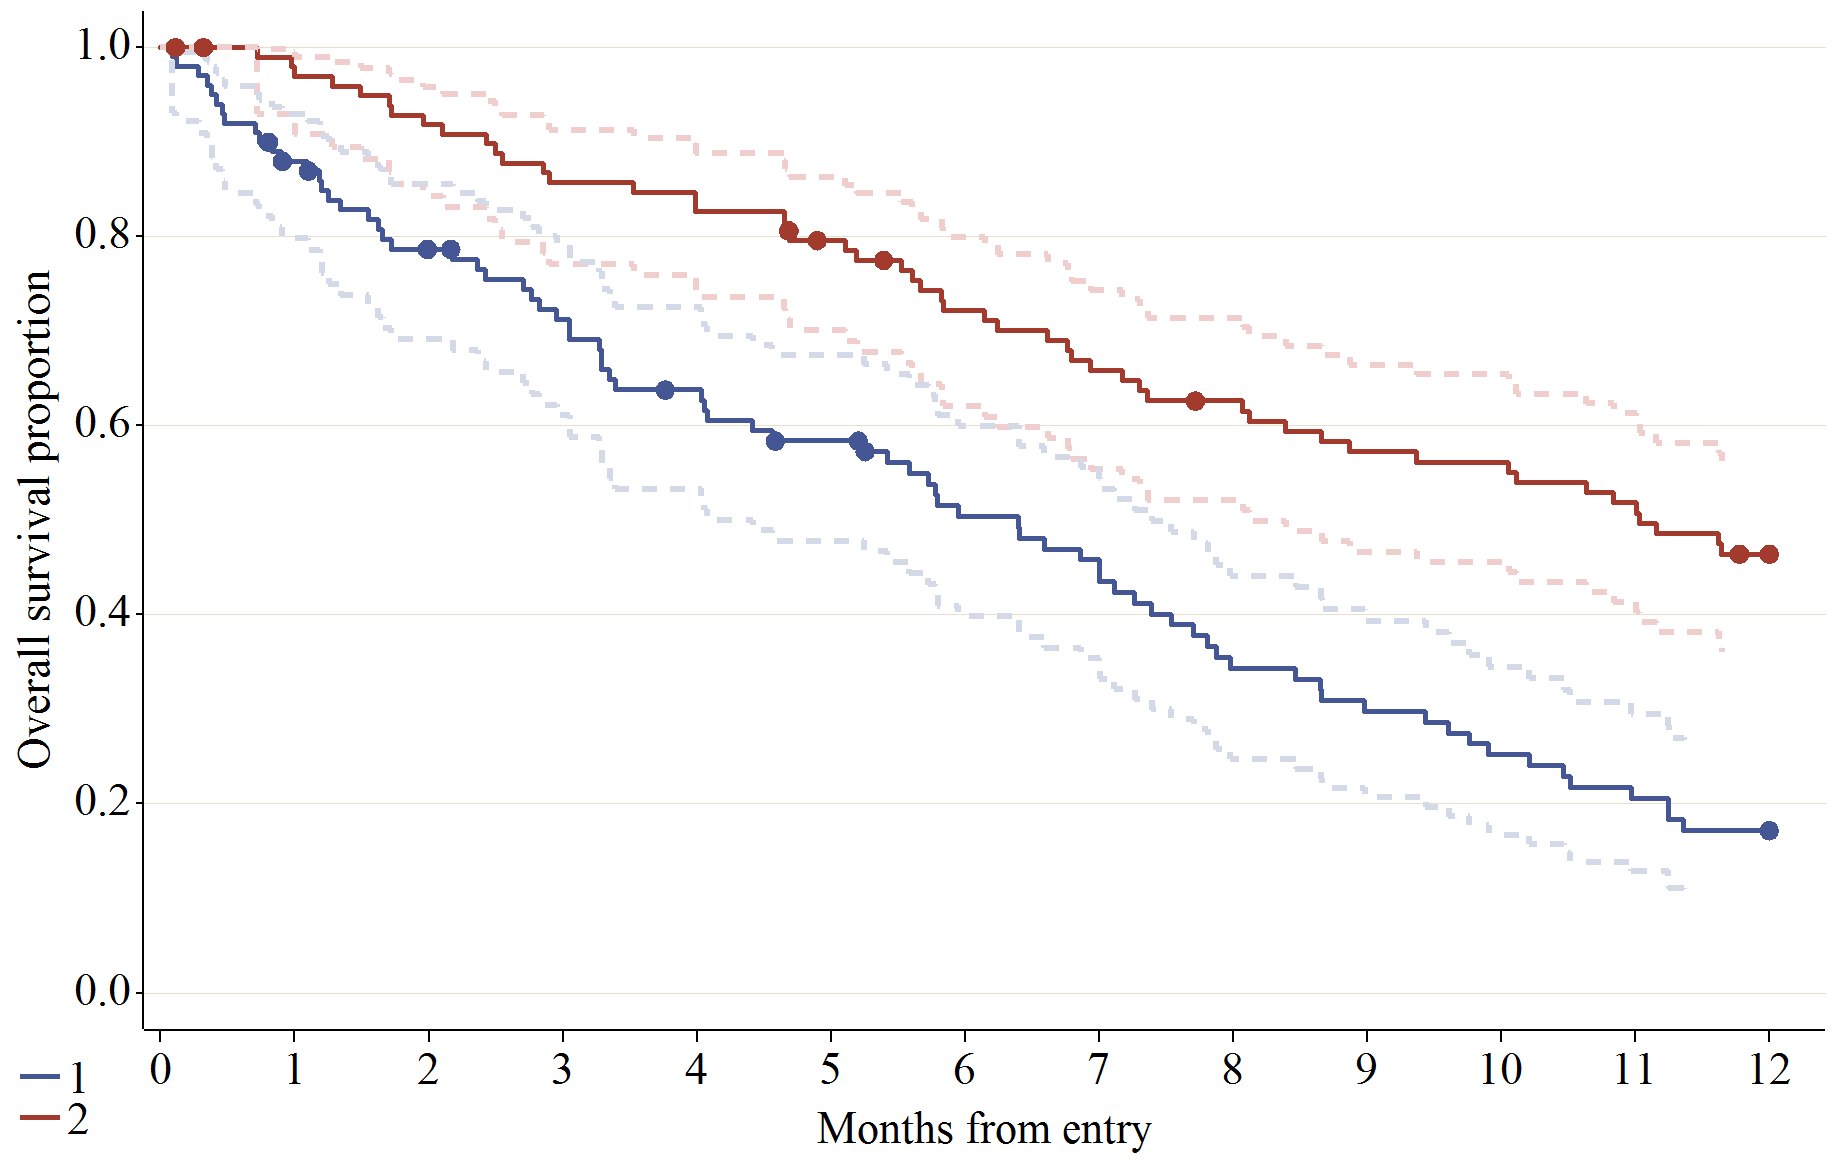
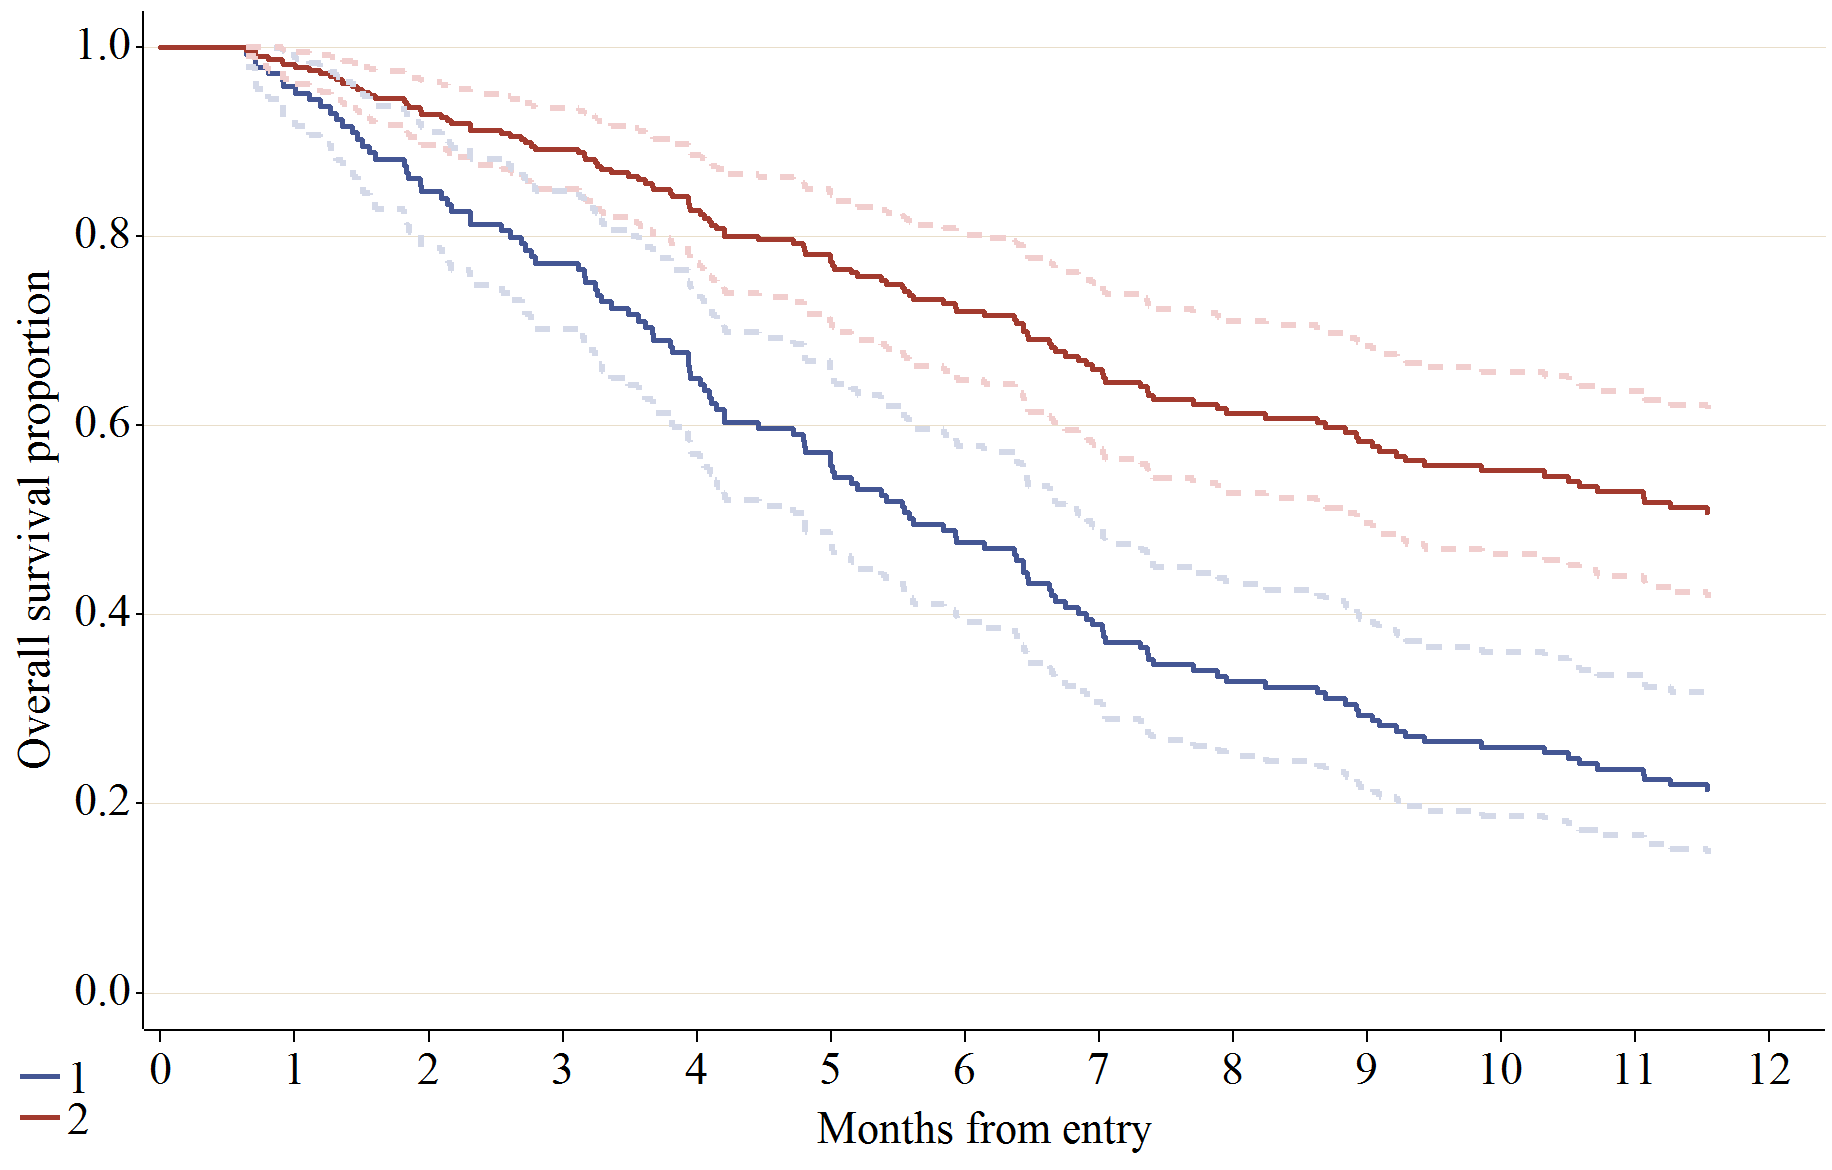
Confidence interval (dotted line):
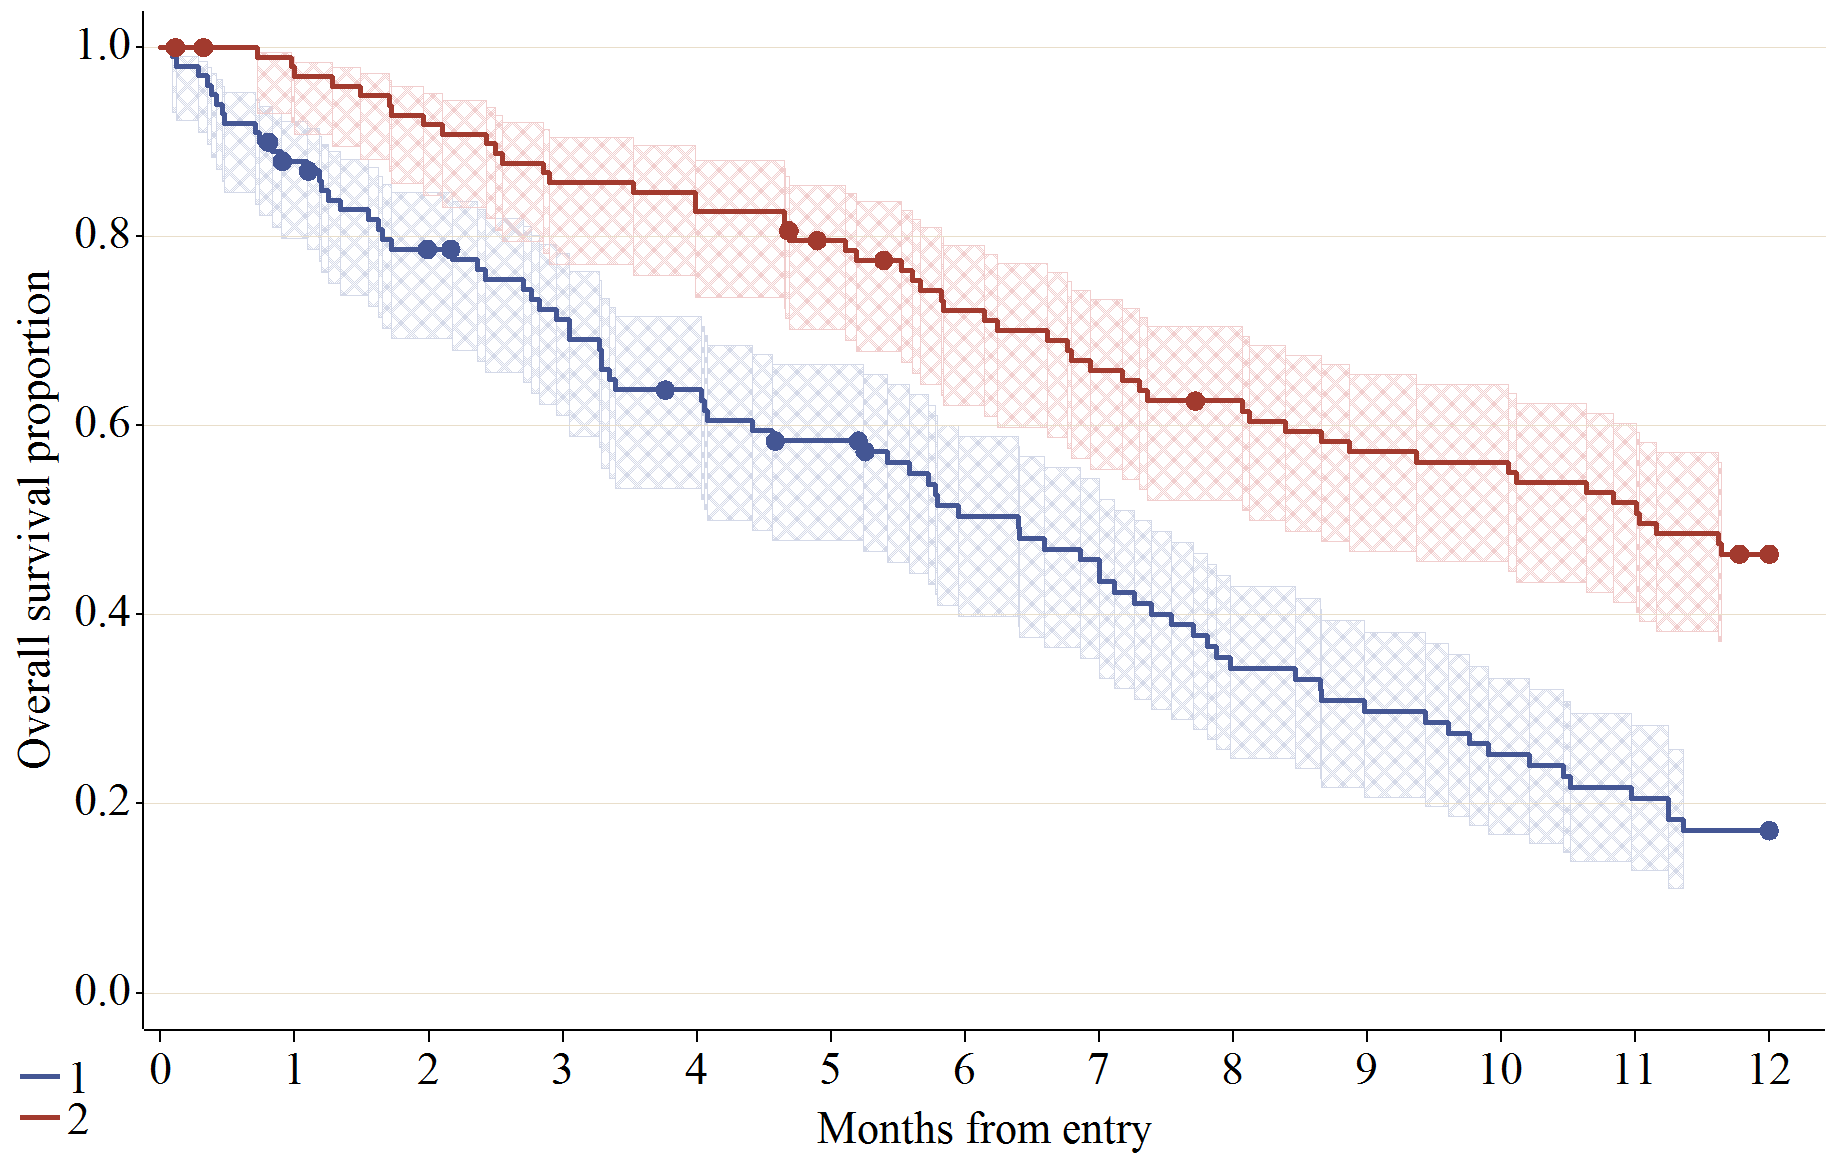
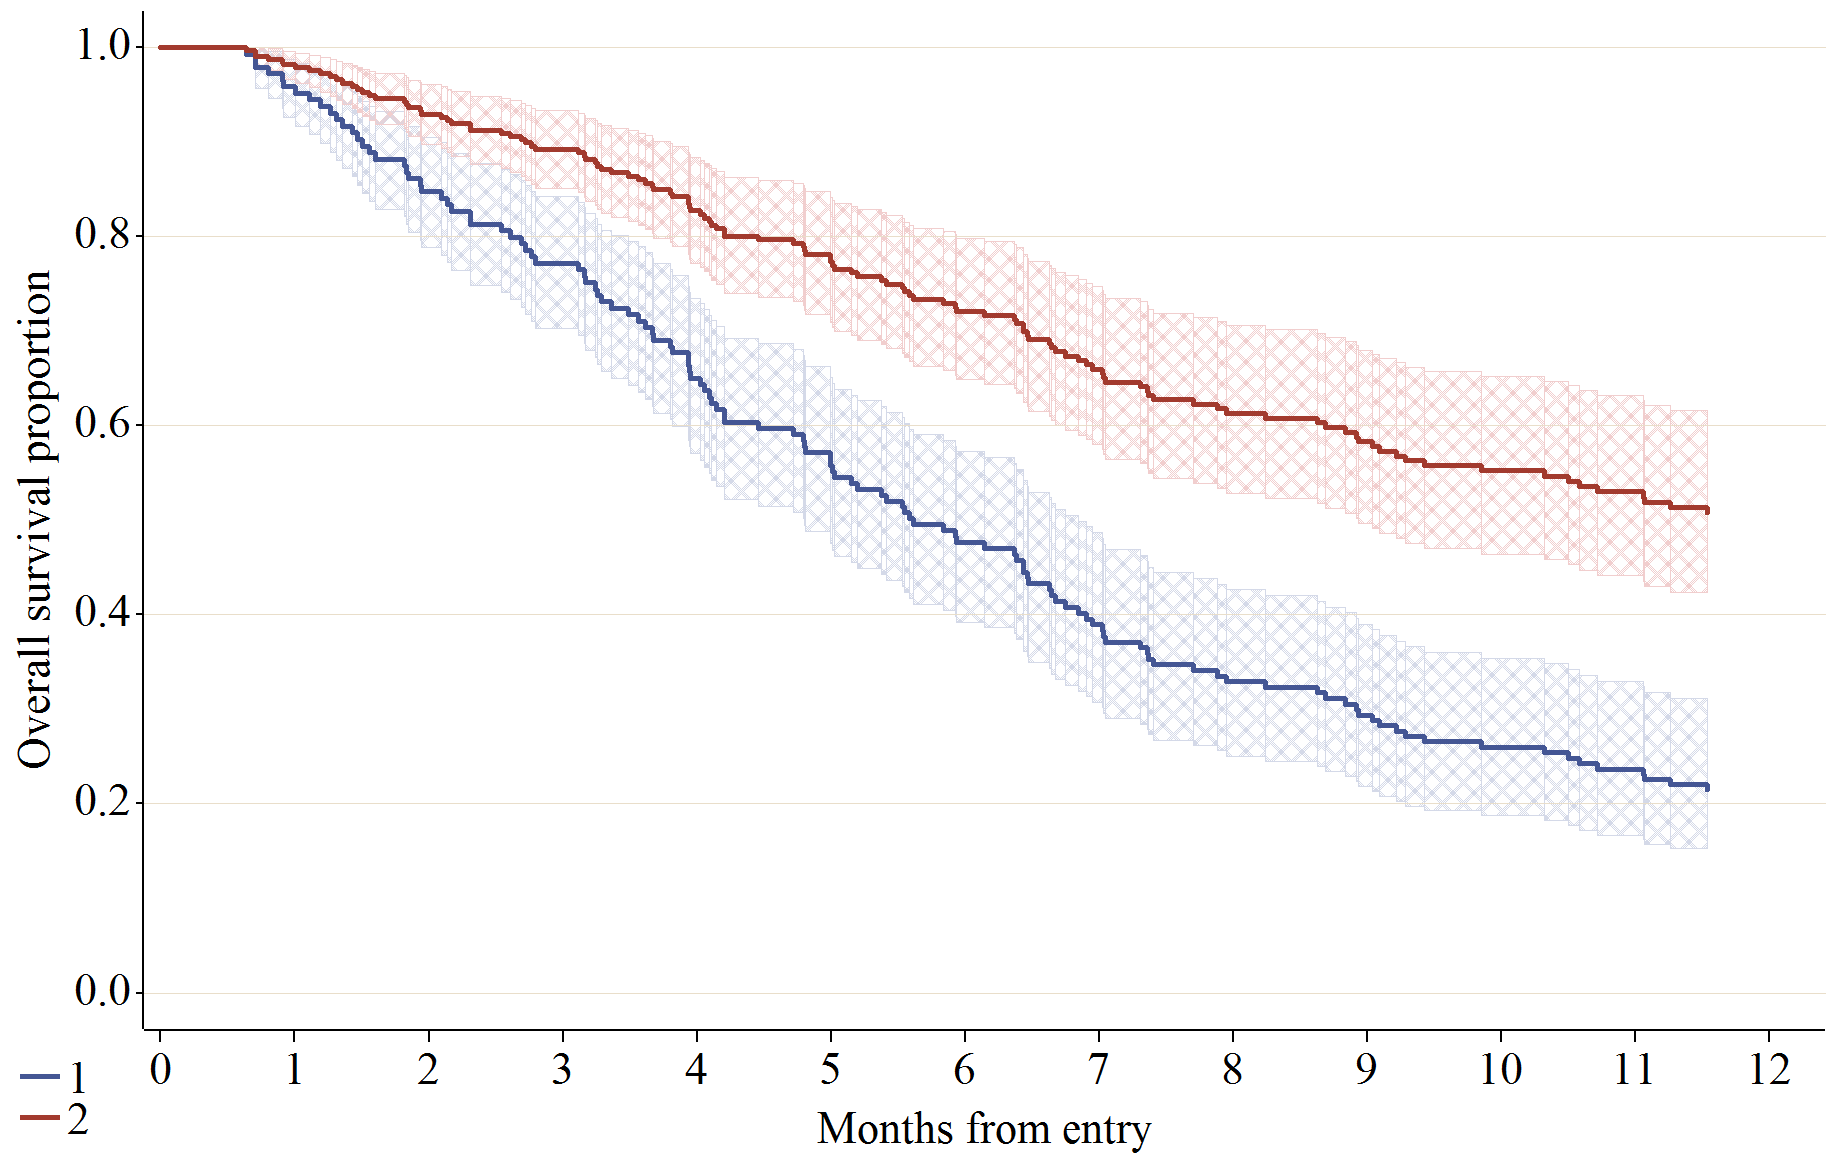
Confidence interval (meshed):
No. at risk on inside:
No. at risk on outside:
Combination (homogeneity test, confidence interval, and no. at risk on outside):
Baseline adjusted plot:
Baseline adjusted failure plot:
Baseline adjusted plot with confidence interval (dotted line):
Baseline adjusted plot with confidence interval (meshed):
Last updated date
- 2011/10/19
