色々な形式でグラフを出力する
goptions statement
goptions statement の device option を使います。
  filename grafout "drive:\path\filename.ext";
  goptions device = driver-name gsfname = grafout gsfmode = replace;
filename にフルパスでファイル名を指定します。
device = driver-nameに出力形式を指定します。
driver-name
| gif |
800x600 pixelのgif形式 出力サイズに制限があるので使いにくい。 |
| jpeg |
jpeg形式、オプションで変えられるかもしれませんが、モスキートノイズがかなりひどいです。 出力サイズに制限があるので使いにくい。 |
| bmp |
256色ビットマップ、サイズは恐らく任意。 gifやjpgを使うならbmp経由でレタッチソフトを使って変換した方がよい。 |
| emf |
windows enhanced metafile ベクトル画像、フォントは埋め込めない。 |
| pdfc |
pdfファイル(カラー) 何故か指定したフォントを使ってくれないので、使い物にならない。 |
| gifanim |
animation gif形式 使いどころがあまりない。 |
色々指定はできるようですが、ラスタなら bmp、ベクトルなら emf を使うといいと思います。
サンプルスクリプト
適当なディレクトリに保存して実行してください。
保存したディレクトリに "Sample.bmp" を作成します。
  dm 'log; clear; output; clear';

  %let execpath = " ";
  %let Path = " ";
  %macro setexecpath;
    %let execpath = %sysfunc(getoption(sysin));
    %if %length(&execpath) = 0 %then
      %let execpath = %sysget(sas_execfilepath);
    data _null_;
      do i = length("&execpath") to 1 by -1;
        if substr("&execpath", i, 1) = "\" then do;
          call symput("Path", substr("&execpath", 1, i));
          stop;
        end;
      end;
    run;
  %mend setexecpath;
  %setexecpath;

  data sample;
    do x = 0 to 1 by .01;
      y = x**21 + x**13 - x**2 - 3 * x;
      output;
    end;
  run;

  goptions reset = all;
  goptions ftext = 'Times New Roman' ftitle = 'Times New Roman';
  goptions hsize = 6 in vsize = 6 in htitle = 1.6 htext = 1.6;
  options linesize = 130 pagesize = 9999;

  filename grafout "&Path.Sample.bmp";
  goptions device = bmp gsfname = grafout gsfmode = replace;

  proc gplot data = sample;
    plot y * x;
    symbol1 i = splines;
  run; quit;

おまけ (animation gif)
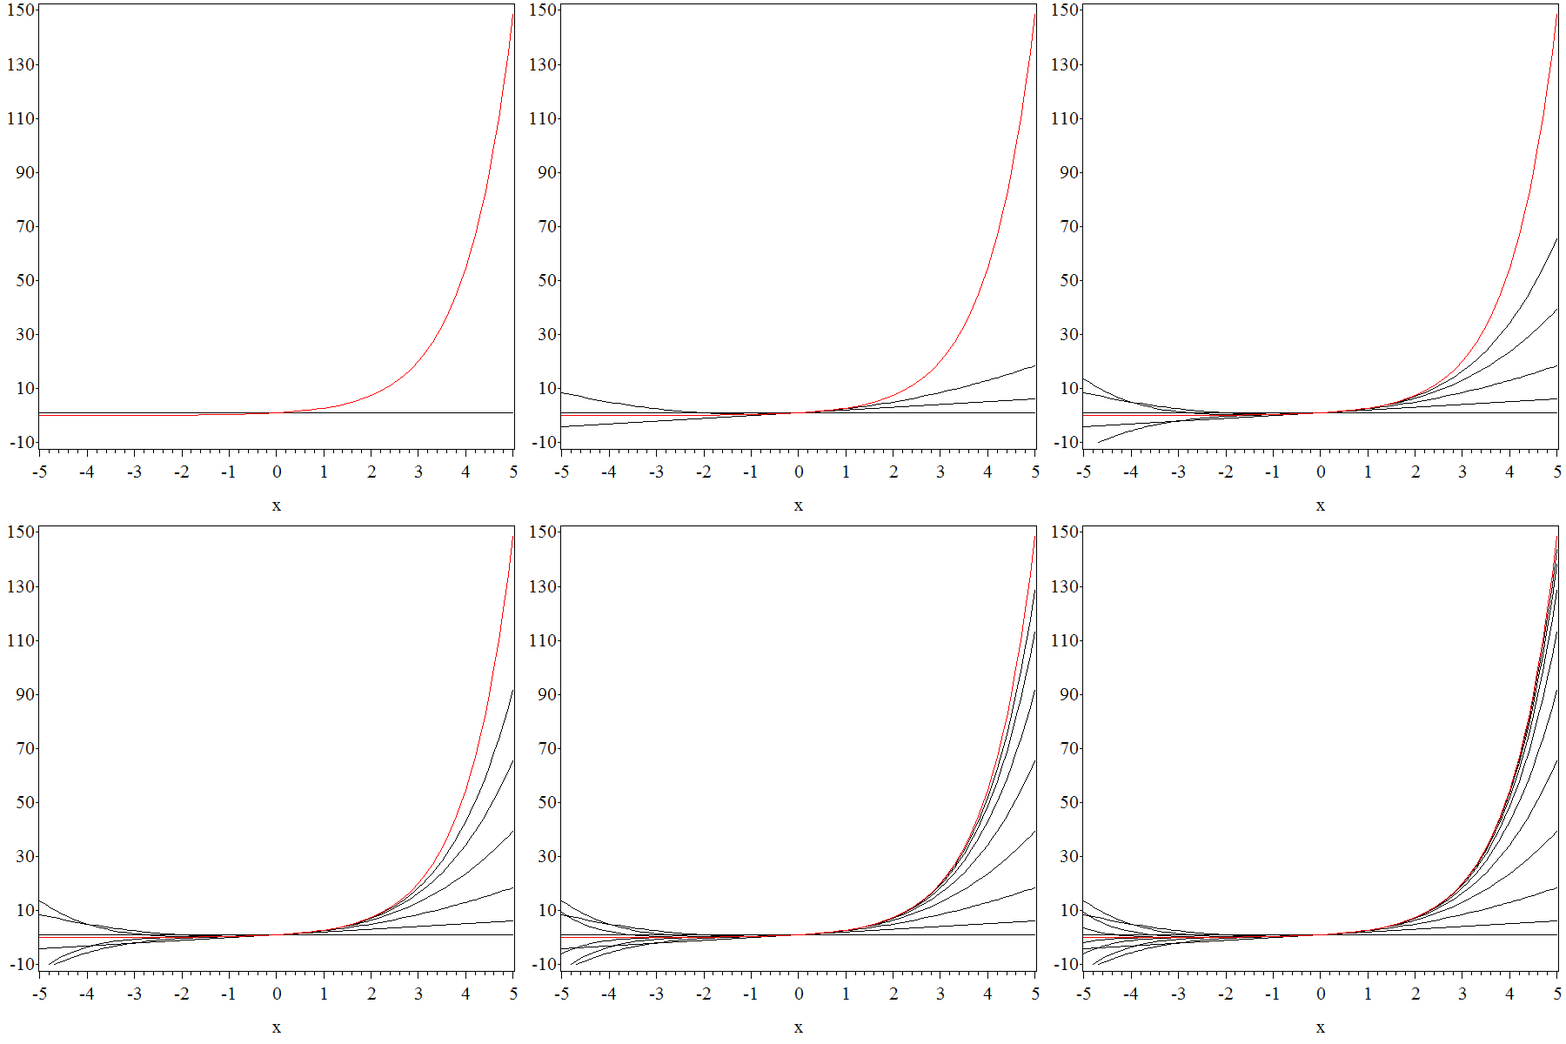
指数関数のテーラー展開です。
剰余項を打ち切っているので、次数が増えてゆくと黒線 (展開したもの) が赤線 (指数関数) 近づいていく様子が分かります、くだらないですね。
download (goptions_anigif.sas)

履歴
- 2009/5/8 公開