Cumulative Incidence Function (CIF) の推定について
SAS/STAT 13.1
SAS では competing risk の解析方法が今まで正式にサポートされてこなかったため、Gray (1988) の方法を実装した%CIF マクロを使うしかありませんでした。 ちなみに、Gray (1988) は Kaplan–Meier 推定量ベースの CIF 推定量と、それを利用した class K 統計量を提案しており、ノンパラメトリックな competing risk の解析方法として広く利用されてきました。
最近になって SAS/STAT 13.1 で機能追加が行われ、Procedure だけで基本的な competing risk の解析を全て行う事ができるようになりました。 SAS/STAT 13.1以降では、PHREG Procedureのmodel statementでeventcodeオプションを指定することで、Fine and Gray (1999) のモデルが利用できるようになりました。 Fine and Gray (1999) のモデルも、Cox モデルベースの competing risk の解析方法として広く利用されていると思います。 この機能追加にともなって、baseline statement で、Fine and Gray (1999) の baseline cumulative subdistribution hazard の推定量が計算できるようになりました。 Baseline cumulative subdistribution hazard は、Breslow 推定量ベースの CIF 推定量であり、共変量がない場合にGray (1988) の CIF 推定量とほぼ同じ推測が可能ではないかと思います。 それぞれ Kaplan–Meier 推定量ベースと Breslow 推定量ベースの方法であるため、数値的には若干結果が異なりますが、両者は漸近的に同等であるため、SAS でも簡単に CIF の計算ができるようになったと言えるでしょう。
cif.sas (サンプルプログラム)
SAS/STAT 14.1 (2015/8/18 追記)
SAS/STAT 14.1でさらなる機能追加が行われ、LIFETEST Procedure でノンパラメトリックな competing risk の解析 (%CIF マクロに相当) が実施できるようになりました。 Gray (1988) の検定やノンパラメトリックなCIF推定量が計算できます。
cif_lifetest.sas (サンプルプログラム; LIFETEST Procedure; SAS/STAT
14.1 以降で利用可能)
%CIF マクロとの比較
上記のサンプルプログラムを用いて PHREG Procedure で解析を行った結果と、サンプルプログラムには含めていませんが %CIF マクロで解析を行った結果を以下に示します。 CIF の群間差の検定結果も、CIF の推定結果も大きな差はありませんでした。
PHREG Procedure の検定結果です (STAT 13.1 では検定は Wald 型のみ出力可能です)。
                  Type 3 Tests

                          Wald
  Effect      DF    Chi-Square    Pr > ChiSq

  group        1        3.1487        0.0760
%CIF マクロの検定結果です (Gray's test の結果; class K 統計量なので、Cox モデルのスコア型の検定に近い)。
  Gray's Test for Equality of Cumulative Incidence Functions

                  Chi-              Pr >
                  Square    DF    Chi-Square

                3.10766     1      0.0779
LIFETEST Procedure の検定結果です (SAS/STAT 14.1 以降で利用可能)。
  Gray's Test for Equality of Cumulative Incidence Functions

                                      Pr >
              Chi-Square      DF    Chi-Square

                  3.1077       1      0.0779
PHREG Procedure の baseline cumulative subdistribution
hazard の推定結果をグラフにしたものです。標準誤差の推定方法はシミュレーションベースで実装されており、サンプルプログラムでは 25000 回反復して求めています。
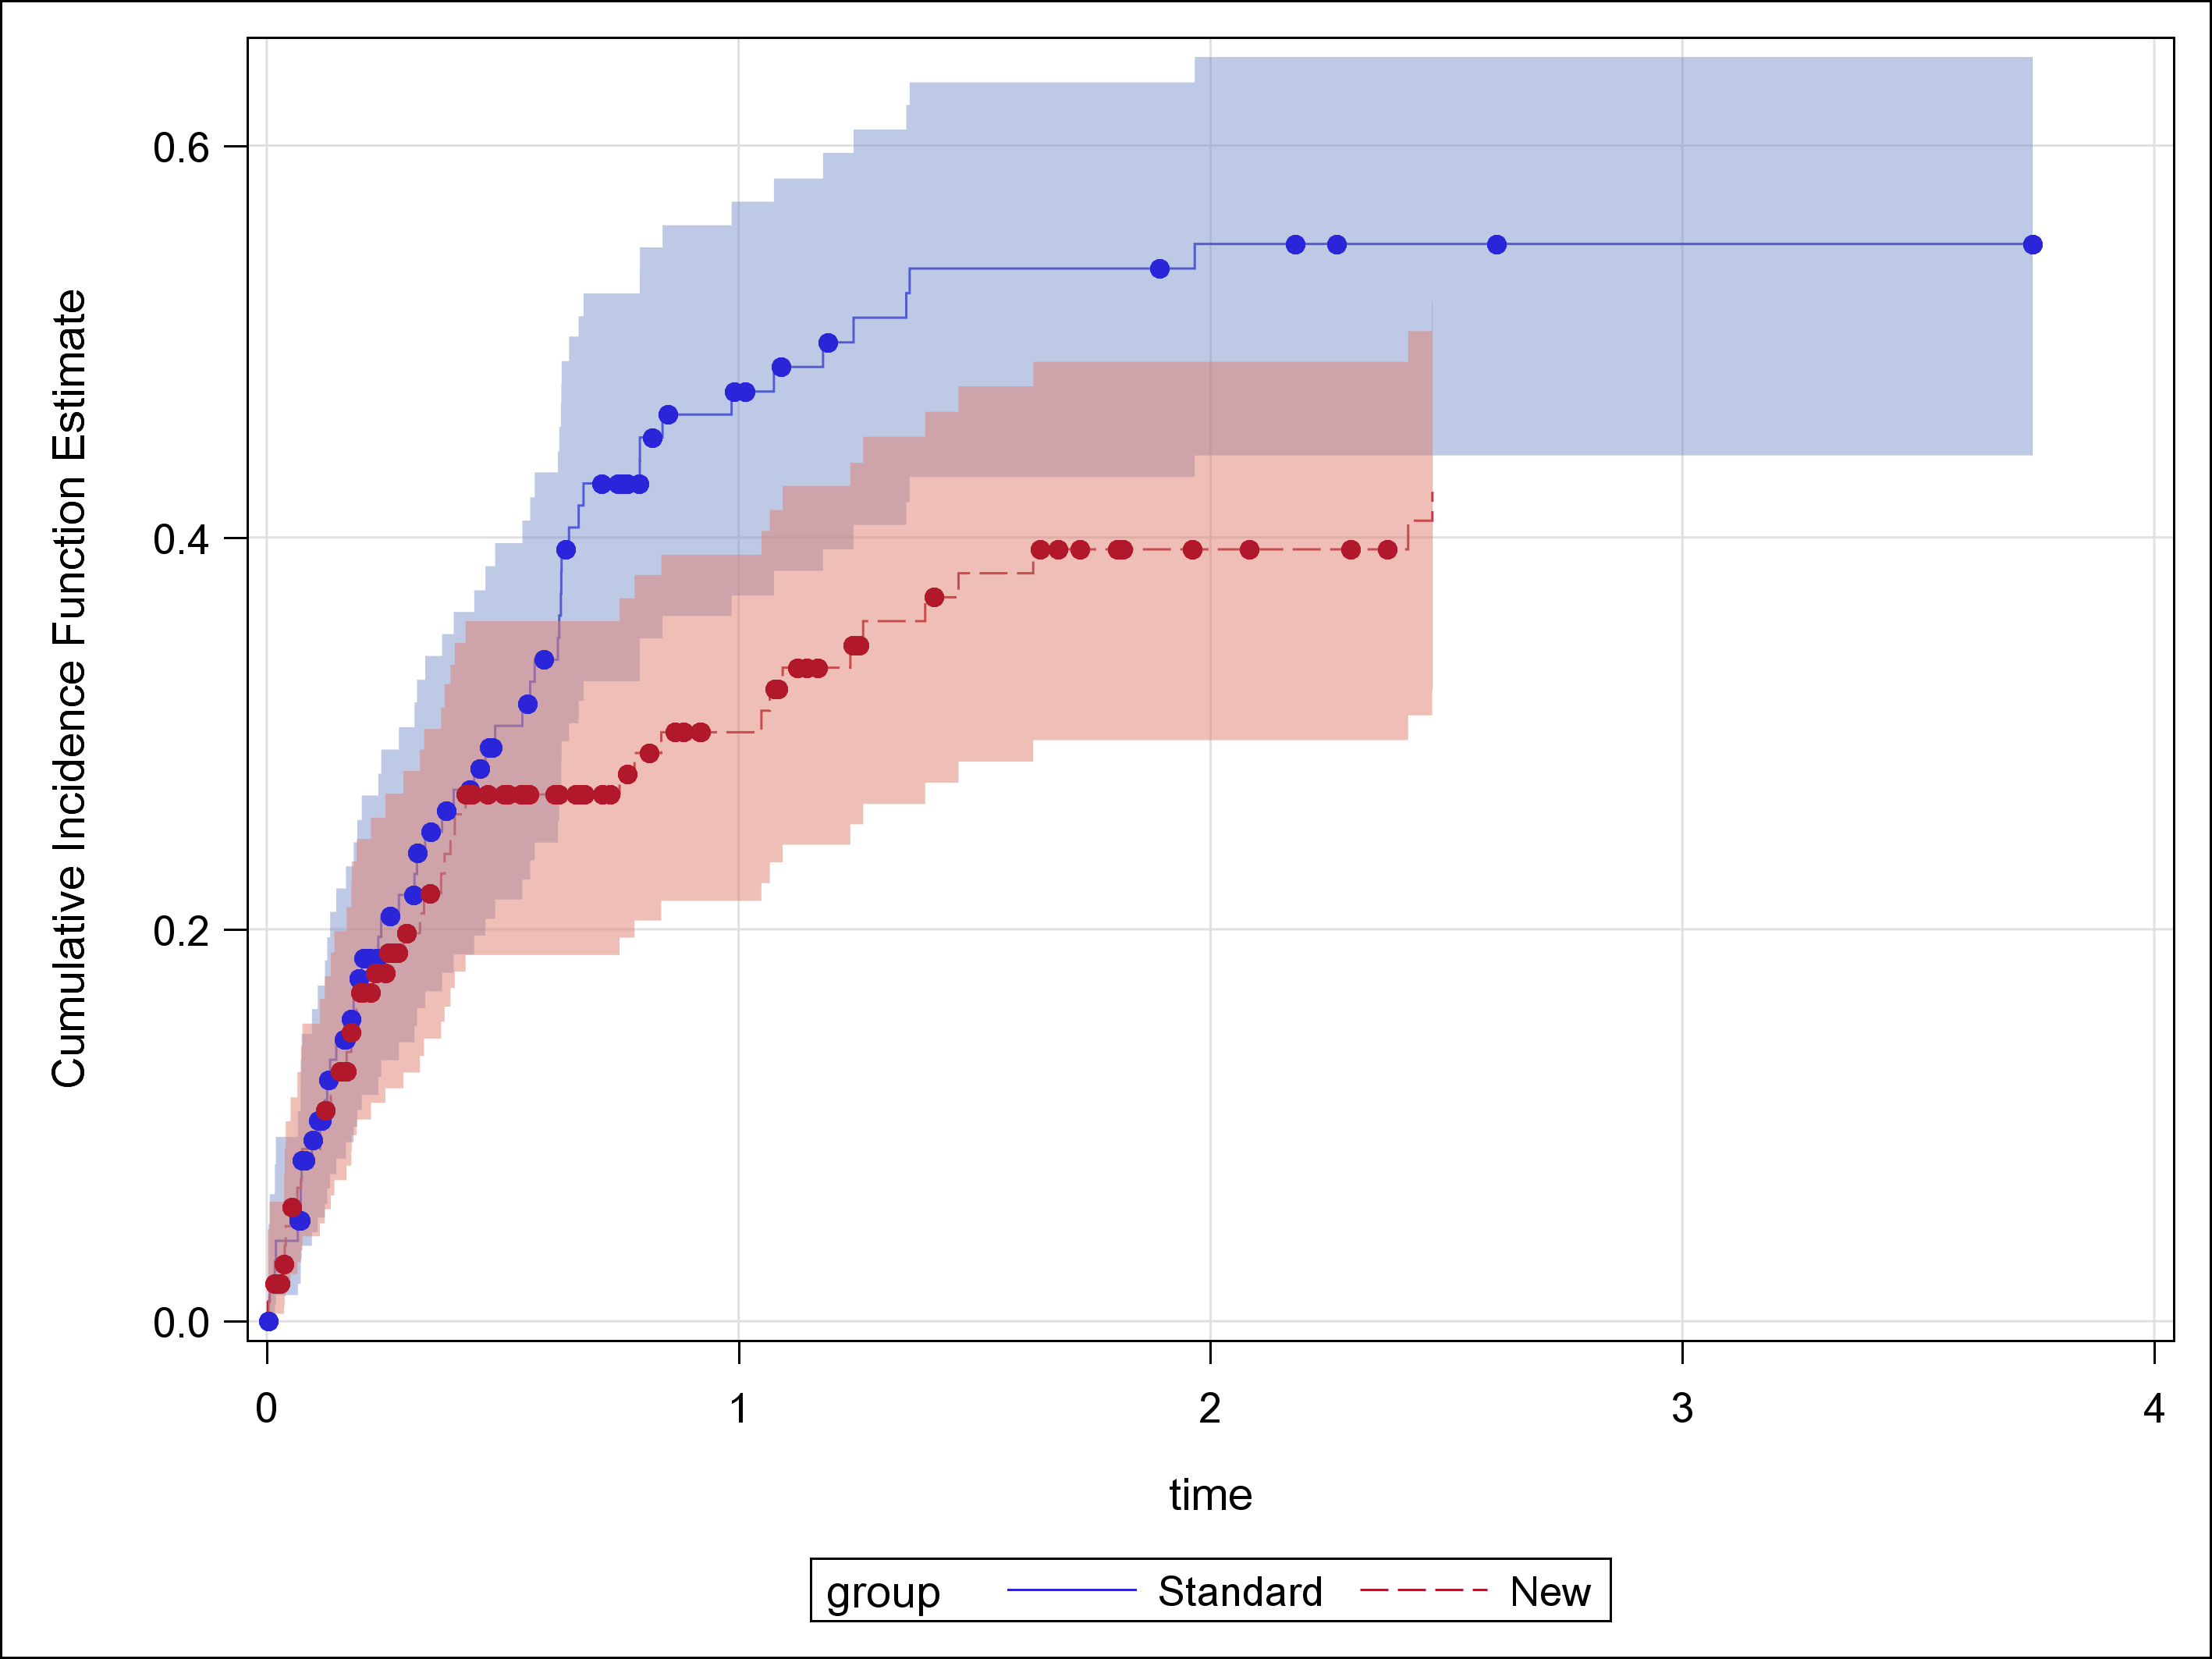
%CIF マクロの CIF 推定結果をグラフにしたものです。

LIFETEST Procedure の CIF 推定結果をグラフにしたものです。
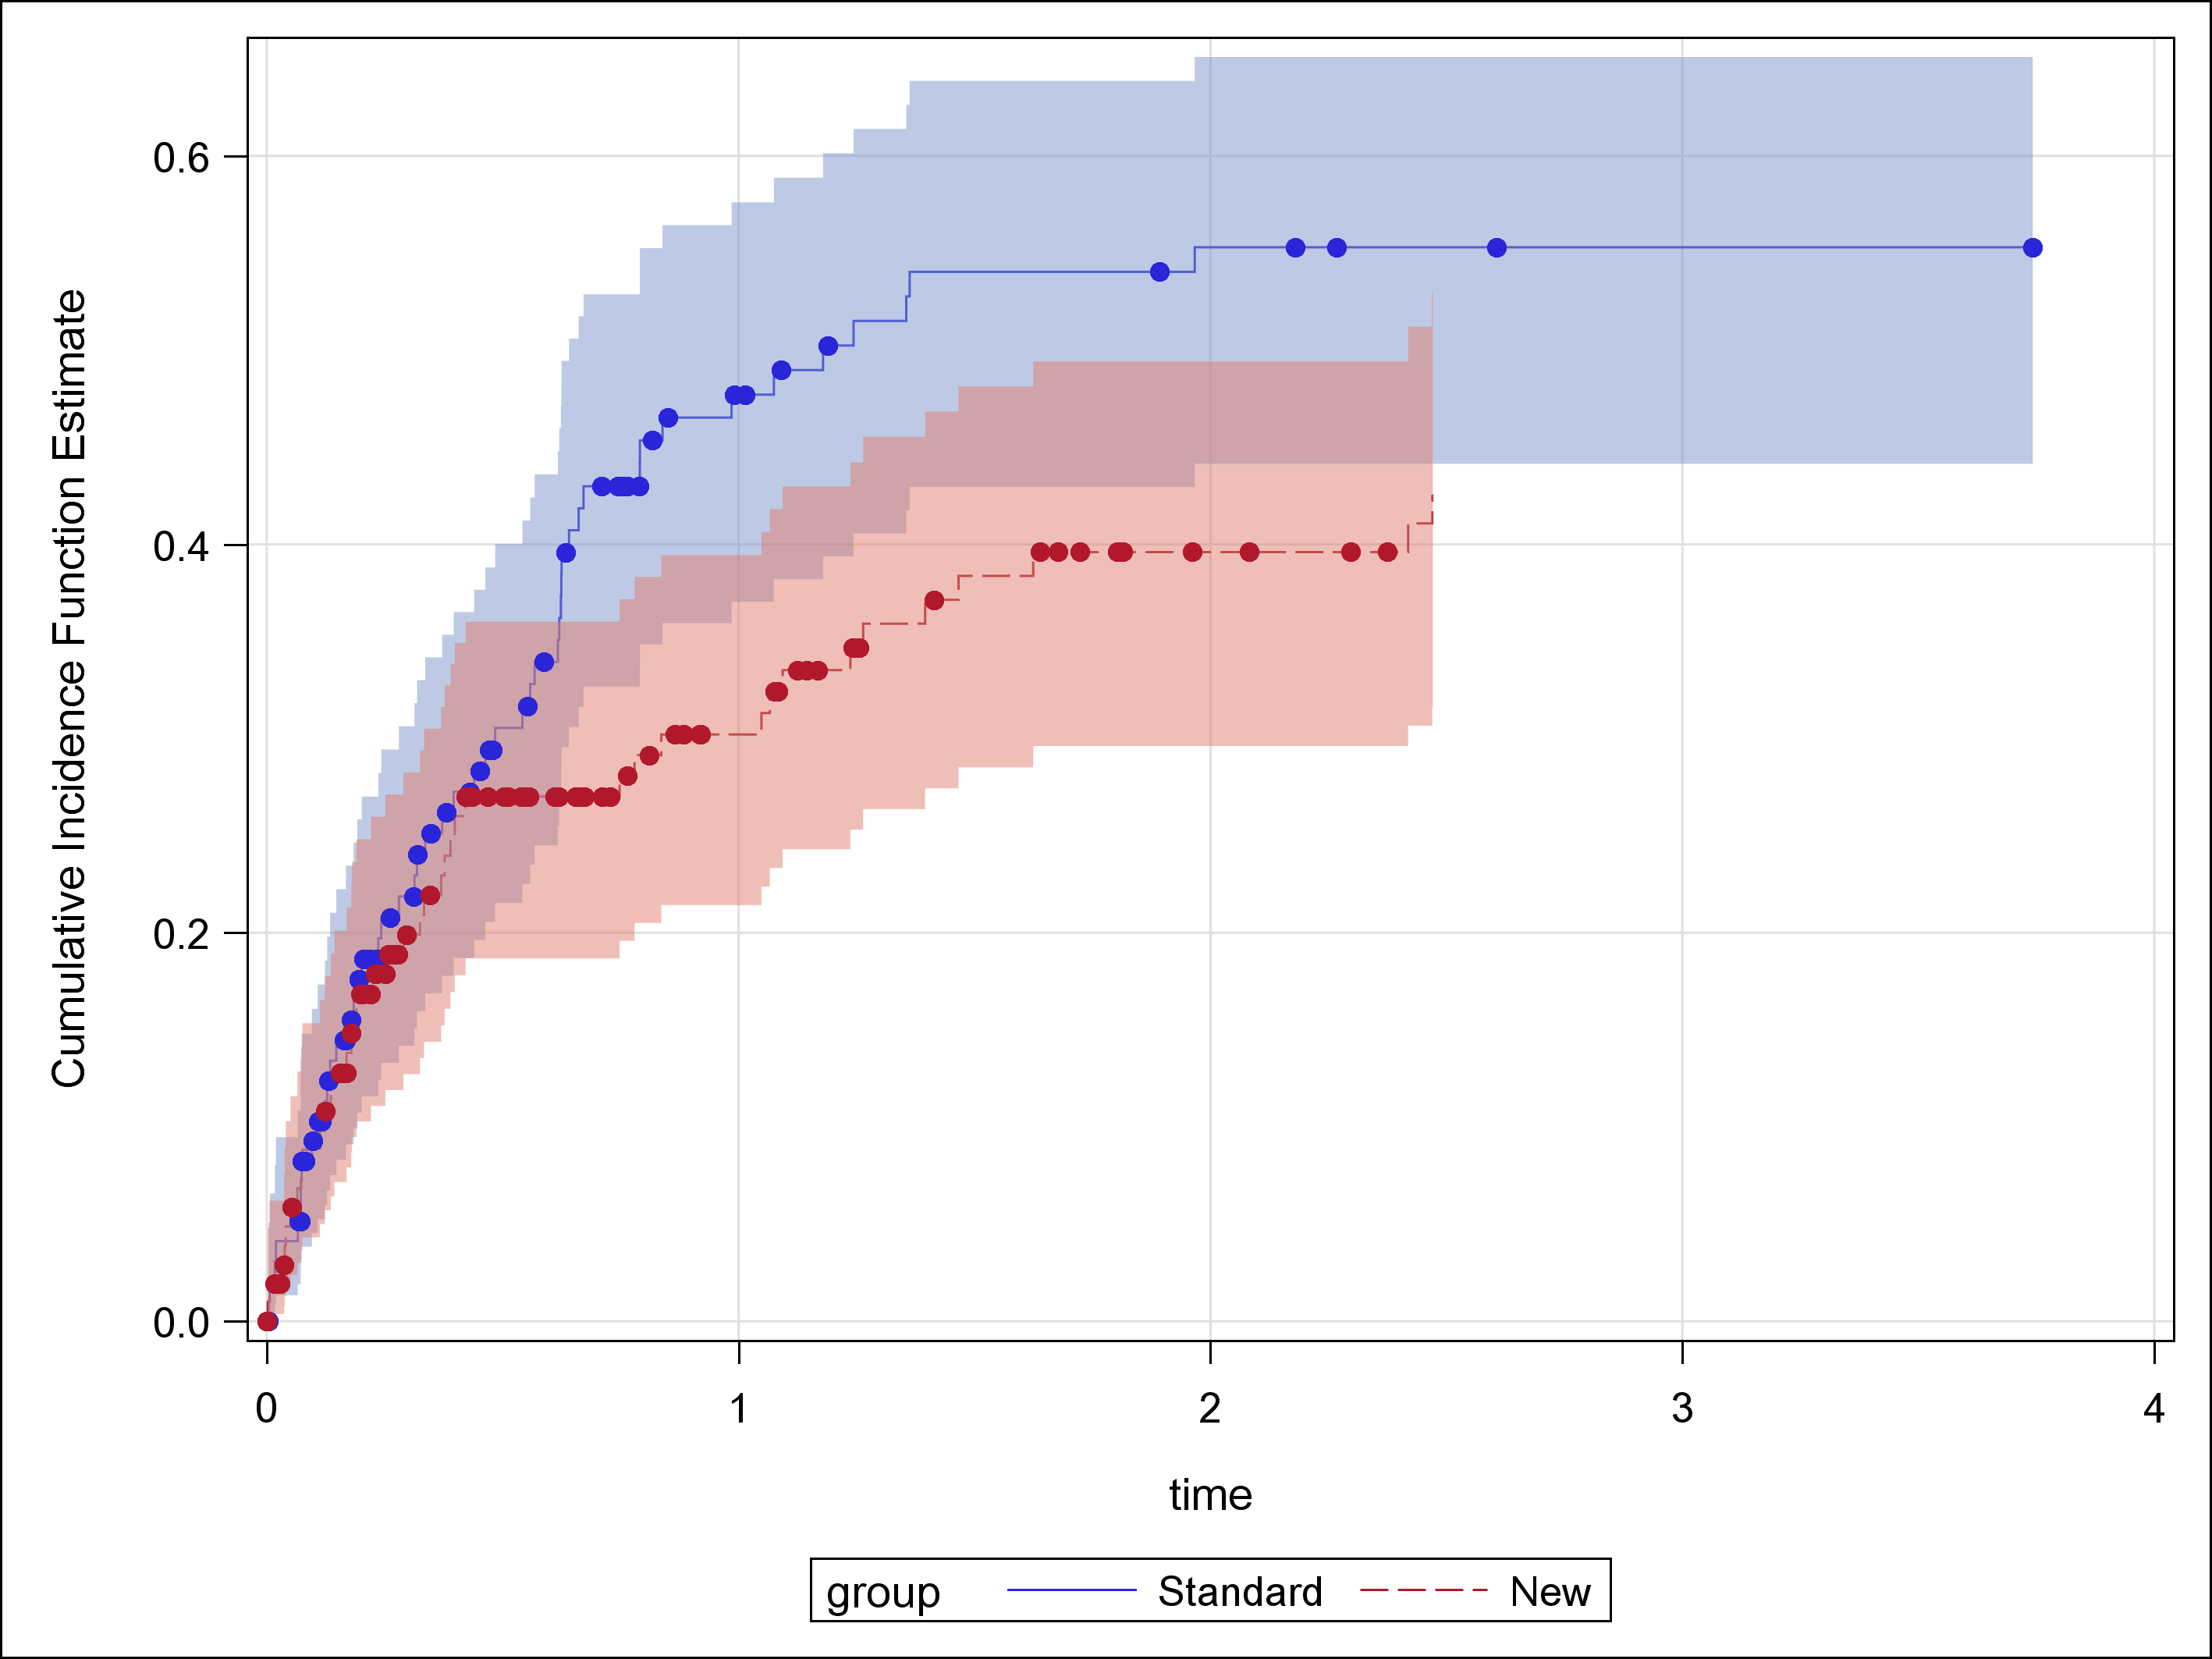
%CIF と LIFETEST は完全に一致し、PHREG とその他は多少違いがありますがほとんど同じグラフが描けました。
PHREG Procedure の eventcode オプション
  proc phreg data = example;
    class group / param = ref ref = first;
    model time*event(0) = group / eventcode = 1;
  run;
Baseline cumulative subdistribution hazard の推定プログラム
  proc phreg data = example;
    model time*event(0) = / eventcode = 1;
    strata group;
    baseline out = out1 cif = _all_ /
      normalsample = 25000 cltype = loglog;
  run;
LIFETEST Procedure の eventcode オプション (SAS/STAT 14.1 以降で利用可能)
  proc lifetest data = example outcif = out1;
    time time*event(0) / eventcode = 1;
    strata group;
  run;
参考文献
- Gray RJ. A class of K-Sample tests for comparing the cumulative incidence of a competing risk. The Annals of Statistics 1988;16(3):1141–1154.
- Fine JP, Gray RJ. A proportional hazards model for the subdistribution of a competing risk. Journal of the American Statistical Association 1999;94(446):496–509.
履歴
- 2015/8/18 SAS/STAT 14.1 に関する記述を追加
- 2015/2/3 公開